. 2008 Dec 17;28(51):13775-85.
doi: 10.1523/JNEUROSCI.3541-08.2008.

Frontal cortex subregions play distinct roles in choices between actions and stimuli

Affiliations

Frontal cortex subregions play distinct roles in choices between actions and stimuli

Peter H Rudebeck et al. J Neurosci. .

Abstract

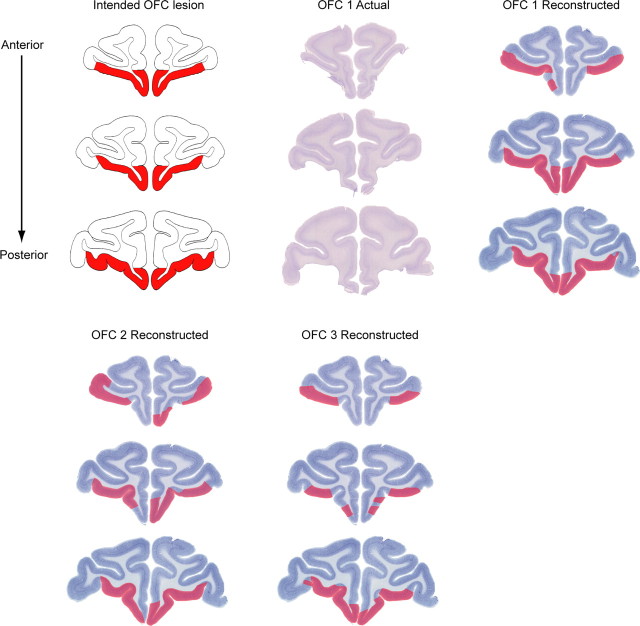
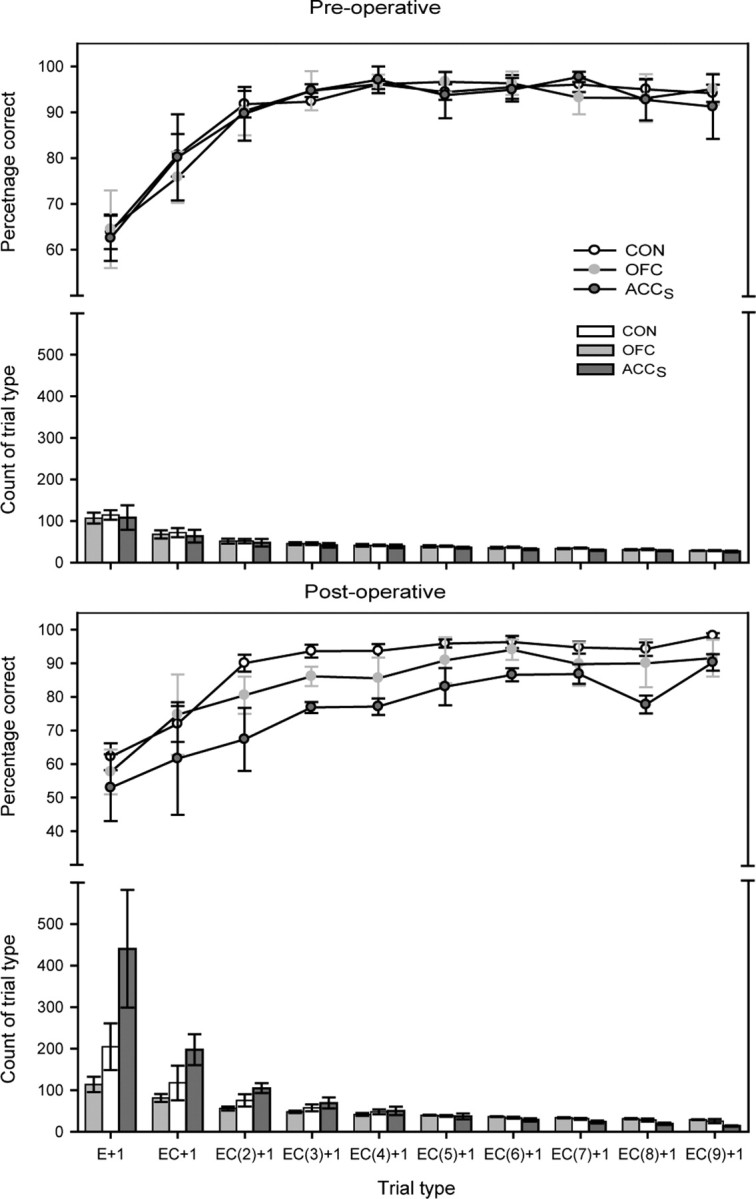
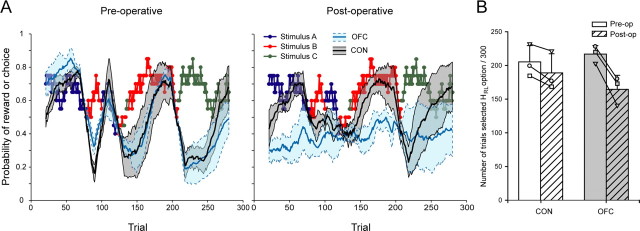
The orbitofrontal cortex (OFC) has been implicated in reinforcement-guided decision making, error monitoring, and the reversal of behavior in response to changing circumstances. The anterior cingulate cortex sulcus (ACC(S)), however, has also been implicated in similar aspects of behavior. Dissociating the unique functions of these areas would improve our understanding of the decision-making process. The effect of selective OFC lesions on how monkeys used the history of reinforcement to guide choices of either particular actions or particular stimuli was studied and compared with the effects of ACC(S) lesions. Both lesions disrupted decision making, but their effects were differentially modulated by the dependence on action- or stimulus-value contingencies. OFC lesions caused a deficit in stimulus but not action selection, whereas ACC(S) lesions had the opposite effect, disrupting action but not stimulus selection. Furthermore, OFC lesions that have previously been found to impair decision making when deterministic stimulus-reward contingencies are switched were found to cause a more general learning impairment in more naturalistic situations in which reward was stochastic. Both OFC and ACC(S) are essential for reinforcement-guided decision making rather than just error monitoring or behavioral reversal. The OFC and ACC(S) are both, however, more concerned with learning and making decisions, but their roles in selecting between stimulus and action values are distinct.


Figures

Figure 1.
Figure 1.
Experimental task design and apparatus. A, Overview of the factorial design used for experiments 1–4. The abscissa shows the two different response modalities used, action or stimulus based, whereas the two different types of reward delivery, deterministic or stochastic, are shown on the ordinate. Experiments 1 and 2 are both action based, because macaques must make responses using a joystick. In experiment 1, reward delivery is deterministically absent or present, whereas in experiment 2, reward delivery is stochastic. For experiments 3 and 4, macaques choose between different stimuli on a touch screen (black area with distinct picture stimuli). Reward delivery in both of these experiments was stochastic. Previous experiments have determined the role of OFC and ACCS in stimulus-based deterministic tasks (Iversen and Mishkin, 1970; Izquierdo et al., 2004; Rudebeck et al., 2006a). Numbers surrounded by the red dashed lines are examples of the possible probability of reward associated with the different actions or stimuli that could be selected by the macaques. B, Three-choice stimulus discrimination task. On each trial, three stimuli were presented on a touch screen in one of four spatial configurations (trials n to n + 2). The configuration on a given trial was randomly selected. The spatial position of each stimulus within each configuration was further randomized. C, Predetermined reward schedule used in experiment 4. On each trial, the schedule determined whether a reward would be dispensed for choosing a particular stimulus (stimuli A–C). The probability of reward associated with each stimulus for a given trial was calculated from these schedules using a 20 trial moving window.
Figure 2.
Figure 2.
Plots used to derive the ratio of responses associated with the maximum rate of reward for each pair of reward probabilities (1:0, 0.75:025, 0.5:0.2, 0.4:0.1, and 0.5:0.18). Each plot shows expected reward rate or food pellets (y-axis) associated with the range of possible response ratios (high-option responses to low-option responses) (x-axis). For the top two rows of plots, the maximum expected reward rate (pellets) is 1 because macaques are only able to receive a single reward per trial (equal reward condition). For the bottom row, marked differential reward, the expected rate of reward (pellets) per trial can be >1 because macaques could potentially receive either two or four pellets per trial depending on the stimulus they selected. The area marked by the gray box highlights the ratio of responses associated with at least 97% of the maximum reward rate and the corresponding range of response ratios.
Figure 3.
Figure 3.
OFC lesion histology. The first column shows the area of intended lesion and the boundary of the OFC, shaded red, on schematic coronal sections through the macaque brain. The second column shows photomicrographs of cresyl violet-stained coronal sections from case OFC 1 (OFC 1 Actual). In the third column, the amount of tissue removed bilaterally is reconstructed and shown in red on a series of cresyl violet-stained coronal sections from a normal rhesus monkey brain (OFC 1 Reconstructed). In the bottom two columns, the OFC lesions in cases OFC 2 and OFC 3 are represented on the same series of sections used for case OFC 1 (OFC 2 and OFC 3 Reconstructed).
Figure 4.
Figure 4.
Performance in experiment 1. A, Mean (±SEM) performance 10 trials before and 10 trials after an imposed switch preoperatively and postoperatively. Control, OFC, and ACCS group data are shown by open, light gray, and dark gray circles, respectively. B, Performance on trials immediately after either a correct (Correct+1) or an incorrect error (Error+1) response. Preoperative performance is shown in open bars, whereas postoperative performance is shown in hatched bars. The performance of individual macaques, within each group, is represented by distinct symbols. For both A and B, mean and SEM values are based on the data from five preoperative and postoperative sessions.
Figure 5.
Figure 5.
Performance in experiment 1: preoperative (top) and postoperative (bottom) performance for sustaining the rewarded action after an error (EC analysis). The first trial type shown on the far left of the x-axis describes the mean (±SEM) performance immediately after an error (E+1). The next trial type describes the performance immediately after a single error and then a single correct response (EC+1), the one after shows the performance after a single error and two serially correct responses (EC+2), and so on. The data of CON, OFC, and ACCS groups are shown by open, light gray, and dark gray circles, respectively. The top parts of the graphs show the mean (±SEM) performance for the different trial types, whereas the bottom parts show the mean (±SEM) number of instances of each trial type.
Figure 6.
Figure 6.
Experiments 2 and 3: learning curves for the action– and stimulus–outcome matching tasks at the reward ratio of 0.75:0.25. A, Mean percentage of trials on which macaques made the action associated with 0.75 probability of reward. B, Mean percentage of trials on which macaques selected the stimulus associated with 0.75 probability of reward. Control, OFC, and ACCS group data are shown by black, light blue, and dark green lines, respectively. The shaded regions represent the SEM associated with each group. The horizontal black dashed line indicates the percentage of 0.75 responses associated with the maximum reward rate, whereas the red dashed lines represent the percentage of 0.75 responses associated with 97% of the maximum reward rate. For both A and B, means and SEM values are based on the data from two postoperative sessions.
Figure 7.
Figure 7.
Performance in experiments 2 and 3. A, Mean (±SEM) number of trials each macaque took to achieve the ratio of responses associated with 97% of the maximum reward rate (r opt) in the action–outcome matching task. B, Mean (±SEM) number of trials each macaque took to achieve r opt in the stimulus–outcome matching task. The unfilled bars represent the CON group, whereas light gray and dark gray represent OFC and ACCS groups, respectively. The performance of individual macaques, within each group, is represented by distinct symbols. For both A and B, mean and SEM values are based on the data from two postoperative sessions.
Figure 8.
Figure 8.
Experiment 4: choices of macaques in the three-choice stimulus–outcome task. A, Mean probability of OFC (solid blue line) and CON (solid black line) groups selecting the stimulus associated with the highest probability of reward (H schedule). The shaded regions represent the SEM associated with each group. The colored points represent the stimulus (stimuli A–C) associated with the highest probability of reward on a given trial. Preoperative and postoperative performance is shown on the left and right, respectively. B, Mean (±SEM) number of trials macaques selected the stimulus associated with the highest probability of reward (H RL) on the basis of the outcomes experienced up to the time of the choice. The performance of individual macaques, within each group, is represented by distinct symbols.

Similar articles

Cited by

References

    1. Amiez C, Joseph JP, Procyk E. Anterior cingulate error-related activity is modulated by predicted reward. Eur J Neurosci. 2005;21:3447–3452. - PMC - PubMed
    1. Amiez C, Joseph JP, Procyk E. Reward encoding in the monkey anterior cingulate cortex. Cereb Cortex. 2006;16:1040–1055. - PMC - PubMed
    1. Baxter MG, Parker A, Lindner CC, Izquierdo AD, Murray EA. Control of response selection by reinforcer value requires interaction of amygdala and orbital prefrontal cortex. J Neurosci. 2000;20:4311–4319. - PMC - PubMed
    1. Behrens TE, Woolrich MW, Walton ME, Rushworth MF. Learning the value of information in an uncertain world. Nat Neurosci. 2007;10:1214–1221. - PubMed
    1. Bush G, Vogt BA, Holmes J, Dale AM, Greve D, Jenike MA, Rosen BR. Dorsal anterior cingulate cortex: a role in reward-based decision making. Proc Natl Acad Sci U S A. 2002;99:523–528. - PMC - PubMed

Publication types

LinkOut - more resources