Prenatal to early postnatal nicotine exposure impairs central chemoreception and modifies breathing pattern in mouse neonates: a probable link to sudden infant death syndrome
- PMID: 19091979
- PMCID: PMC6671915
- DOI: 10.1523/JNEUROSCI.4441-08.2008
Prenatal to early postnatal nicotine exposure impairs central chemoreception and modifies breathing pattern in mouse neonates: a probable link to sudden infant death syndrome
Abstract
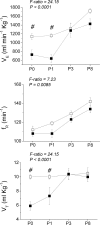
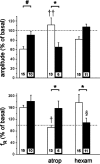
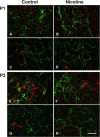
Nicotine is a neuroteratogen and is the likely link between maternal cigarette smoking during pregnancy and sudden infant death syndrome (SIDS). Osmotic minipumps were implanted in 5-7 d CF1 pregnant mice to deliver nicotine bitartrate (60 mg Kg(-1) day(-1)) or saline (control) solutions for up to 28 d. Prenatal to early postnatal nicotine exposure did not modify the number of newborns per litter or their postnatal growth; however, nicotine-exposed neonates hypoventilated and had reduced responses to hypercarbia (inhalation of air enriched with 10% CO(2) for 20 min) and hypoxia (inhalation of 100% N(2) for 20 s) at postnatal days 0-3 (P0-P3). In contrast, at postnatal day 8, nicotine-exposed neonates were indistinguishable from controls. Isolated brainstem-spinal cord preparations obtained from P0 to P3 nicotine-exposed neonates showed fictive respiration with respiratory cycles longer and more irregular than those of controls, as indicated by high short- and long-term variability in Poincaré plots. In addition, their responses to acidification were reduced, indicating compromise of central chemoreception. Furthermore, the cholinergic contribution to central chemosensory responses switched from muscarinic receptor to nicotinic receptor-based mechanisms. No significant astrogliosis was detectable in the ventral respiratory group of neurons with glial fibrillary acidic protein immunohistochemistry. These results indicate that nicotine exposure affects the respiratory rhythm pattern generator and causes a decline in central chemoreception during early postnatal life. Consequently, breathing would become highly vulnerable, failing to respond to chemosensory demands. Such impairment could be related to the ventilatory abnormalities observed in SIDS.
Figures


Similar articles
-
The Alteration of Neonatal Raphe Neurons by Prenatal-Perinatal Nicotine. Meaning for Sudden Infant Death Syndrome.Am J Respir Cell Mol Biol. 2015 Oct;53(4):489-99. doi: 10.1165/rcmb.2014-0329OC. Am J Respir Cell Mol Biol. 2015. PMID: 25695895 Free PMC article.
-
Alterations in cholinergic sensitivity of respiratory neurons induced by pre-natal nicotine: a mechanism for respiratory dysfunction in neonatal mice.Philos Trans R Soc Lond B Biol Sci. 2009 Sep 12;364(1529):2527-35. doi: 10.1098/rstb.2009.0078. Philos Trans R Soc Lond B Biol Sci. 2009. PMID: 19651654 Free PMC article.
-
Perinatal Fluoxetine Exposure Impairs the CO2 Chemoreflex. Implications for Sudden Infant Death Syndrome.Am J Respir Cell Mol Biol. 2016 Sep;55(3):368-76. doi: 10.1165/rcmb.2015-0384OC. Am J Respir Cell Mol Biol. 2016. PMID: 27018763
-
Respiratory dysfunctions induced by prenatal nicotine exposure.Clin Exp Pharmacol Physiol. 2009 Dec;36(12):1205-17. doi: 10.1111/j.1440-1681.2009.05214.x. Epub 2009 May 19. Clin Exp Pharmacol Physiol. 2009. PMID: 19473189 Review.
-
The triple risk hypotheses in sudden infant death syndrome.Pediatrics. 2002 Nov;110(5):e64. doi: 10.1542/peds.110.5.e64. Pediatrics. 2002. PMID: 12415070 Review.
Cited by
-
Long-term effects of early postnatal nicotine exposure on cholinergic function in the mouse hippocampal CA1 region.Neurobiol Learn Mem. 2021 May;181:107445. doi: 10.1016/j.nlm.2021.107445. Epub 2021 Apr 22. Neurobiol Learn Mem. 2021. PMID: 33895349 Free PMC article.
-
Dual recombinase fate mapping reveals a transient cholinergic phenotype in multiple populations of developing glutamatergic neurons.J Comp Neurol. 2020 Feb 1;528(2):283-307. doi: 10.1002/cne.24753. Epub 2019 Aug 22. J Comp Neurol. 2020. PMID: 31396962 Free PMC article.
-
Influence of prenatal nicotine exposure on development of the ventilatory response to hypoxia and hypercapnia in neonatal rats.J Appl Physiol (1985). 2010 Jul;109(1):149-58. doi: 10.1152/japplphysiol.01036.2009. Epub 2010 Apr 29. J Appl Physiol (1985). 2010. PMID: 20431025 Free PMC article.
-
Enduring effects of perinatal nicotine exposure on murine sleep in adulthood.Am J Physiol Regul Integr Comp Physiol. 2017 Sep 1;313(3):R280-R289. doi: 10.1152/ajpregu.00156.2017. Epub 2017 Jun 21. Am J Physiol Regul Integr Comp Physiol. 2017. PMID: 28637659 Free PMC article.
-
Impact of Prenatal Nicotine Exposure on Placental Function and Respiratory Neural Network Development.Adv Exp Med Biol. 2023;1428:233-244. doi: 10.1007/978-3-031-32554-0_10. Adv Exp Med Biol. 2023. PMID: 37466776 Review.
References
-
- Atluri P, Fleck MW, Shen Q, Mah SJ, Stadfelt D, Barnes W, Goderie SK, Temple S, Schneider AS. Functional nicotinic acetylcholine receptor expression in stem and progenitor cells of the early embryonic mouse cerebral cortex. Dev Biol. 2001;240:143–156. - PubMed
-
- Bamford OS, Carroll JL. Dynamic ventilatory responses in rats: normal development and effects of prenatal nicotine exposure. Respir Physiol. 1999;117:29–40. - PubMed
-
- Bamford OS, Schuen JN, Carroll JL. Effect of nicotine exposure on postnatal ventilatory responses to hypoxia and hypercapnia. Respir Physiol. 1996;106:1–11. - PubMed
-
- Benowitz NL, Jacob P., 3rd Daily intake of nicotine during cigarette smoking. Clin Pharmacol Ther. 1984;35:499–504. - PubMed
-
- Benowitz NL, Jacob P., 3rd Nicotine and cotinine elimination pharmacokinetics in smokers and nonsmokers. Clin Pharmacol Ther. 1993;53:316–323. - PubMed
Publication types
MeSH terms
Substances
LinkOut - more resources
Full Text Sources
Medical
