

Relationship between dialysis modality and mortality
- PMID: 19092128
- PMCID: PMC2615722
- DOI: 10.1681/ASN.2007111188
Relationship between dialysis modality and mortality
Abstract
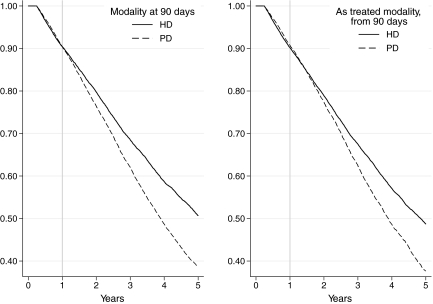
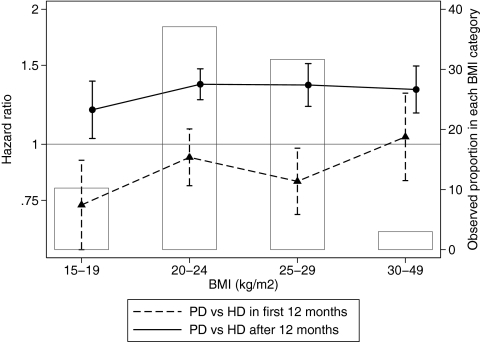
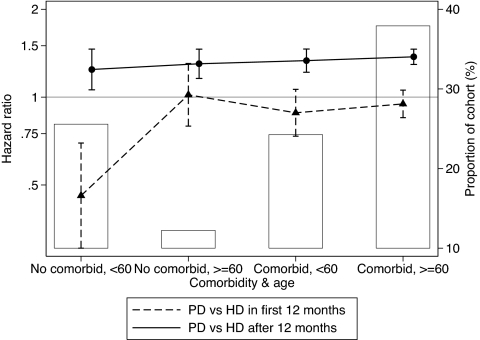
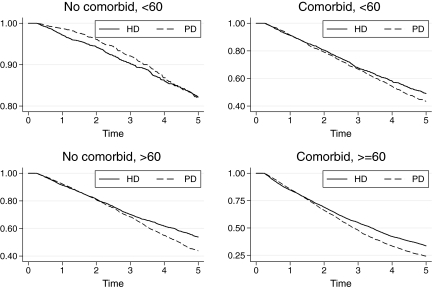
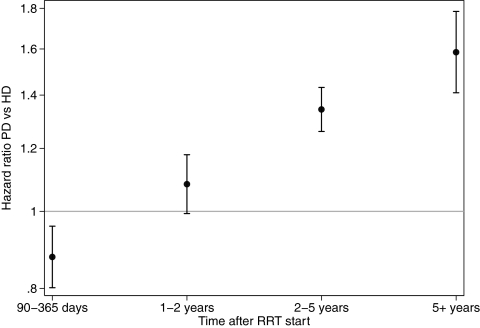
Mortality differences between peritoneal dialysis (PD) and hemodialysis (HD) are widely debated. In this study, mortality was compared between patients treated with PD and HD (including home HD) using data from 27,015 patients in the Australia and New Zealand Dialysis and Transplant Registry, 25,287 of whom were still receiving PD or HD 90 d after entry into the registry. Overall mortality rates were significantly lower during the 90- to 365-d period among those being treated with PD at day 90 (adjusted hazard ratio [HR] 0.89; 95% confidence interval [CI] 0.81 to 0.99]; P < 0.001). This effect, however, varied in direction and size with the presence of comorbidities: Younger patients without comorbidities had a mortality advantage with PD treatment, but other groups did not. After 12 mo, the use of PD at day 90 was associated with significantly increased mortality (adjusted HR 1.33; 95% CI 1.24 to 1.42; P < 0.001). In a supplementary as-treated analysis, PD treatment was associated with lower mortality during the first 90 d (adjusted HR 0.67; 95% CI 0.56 to 0.81; P < 0.001). These data suggest that the effect of dialysis modality on survival for an individual depends on time, age, and presence of comorbidities. Treatment with PD may be advantageous initially but may be associated with higher mortality after 12 mo.
Figures

References
-
- Vonesh EF, Snyder JJ, Foley RN, Collins AJ: Mortality studies comparing peritoneal dialysis and hemodialysis: What do they tell us? Kidney Int 70: S3, 2006 - PubMed
-
- Gutman RA, Blumenkrantz MJ, Chan YK, Barbour GL, Gandhi VC, Shen FH, Tucker T, Murawski BJ, Coburn JW, Curtis FK: Controlled comparison of hemodialysis and peritoneal dialysis: Veterans Administration multicenter study. Kidney Int 26: 459–470, 1984 - PubMed
-
- Korevaar JC, Feith GW, Dekker FW, van Manen JG, Boeschoten EW, Bossuyt PM, Krediet RT: Effect of starting with hemodialysis compared with peritoneal dialysis in patients new on dialysis treatment: A randomized controlled trial. Kidney Int 64: 2222–2228, 2003 - PubMed
-
- Burton PR, Walls J: Selection-adjusted comparison of life-expectancy of patients on continuous ambulatory peritoneal dialysis, haemodialysis, and renal transplantation. Lancet 1: 1115–1119, 1987 - PubMed
-
- Vonesh EF, Moran J: Mortality in end-stage renal disease: A reassessment of differences between patients treated with hemodialysis and peritoneal dialysis. J Am Soc Nephrol 10: 354–365, 1999 - PubMed
MeSH terms
LinkOut - more resources
Full Text Sources
Other Literature Sources
Medical
Molecular Biology Databases
