

A simulation study to evaluate the impact of the number of lesions measured on response assessment
- PMID: 19095439
- PMCID: PMC2652848
- DOI: 10.1016/j.ejca.2008.11.010
A simulation study to evaluate the impact of the number of lesions measured on response assessment
Abstract
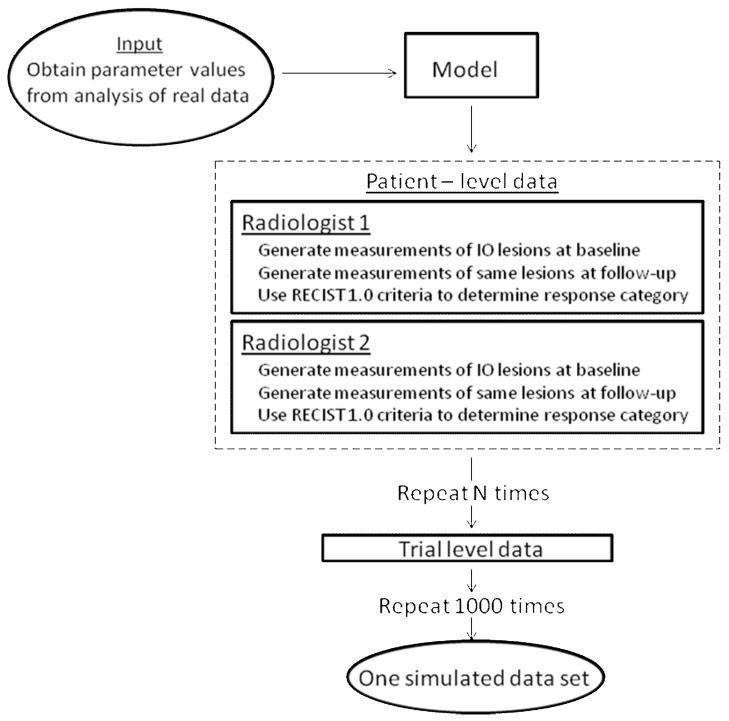
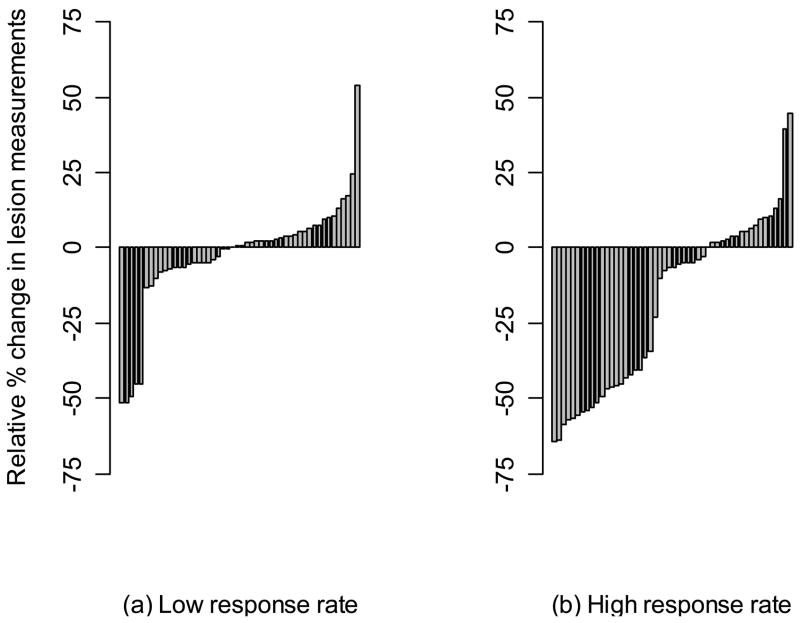
The objectives of this study were to evaluate whether the number of lesions that are used to measure tumour burden affects response assessment and inter-rater variability. In order to accomplish this, a simulation study was conducted. Data were generated from a mixed-effects mixture model. Parameter values to input in the model were obtained from the analysis of real data. Response assessments based on 10, five, three, two and one lesion were evaluated. There was little difference between response assessments based on five lesions and response assessments based on 10 lesions. When fewer than five lesions were used to assess response, there were notable differences from the 10 lesion-based response assessment. Basing response assessment on a small number of lesions tends to overestimate response rates and leads to misclassification of patients' response status. Therefore, measuring five lesions per patient appears to sufficiently capture patients' response to therapy. Measuring fewer than five lesions results in the loss of information that may adversely affect clinical trial results as well as patient management.
Conflict of interest statement
Conflict of Interest
None declared
Figures
References
-
- Therasse P, Arbuck SG, Eisenhauer EA, Wanders J, Kaplan RS, Rubinstein L, Verweij J, Van Glabbeke M, van Oosterom AT, Christian MC, Gwyther SG. New guidelines to evaluate the response to treatment in solid tumors. European Organization for Research and Treatment of Cancer, National Cancer Institute of the United States, National Cancer Institute of Canada. J Natl Cancer Inst. 2000 Feb 2;92(3):205–216. - PubMed
-
- Schwartz LH, Mazumdar M, Brown W, Smith A, Panicek DM. Variability in response assessment in solid tumors: effect of number of lesions chosen for measurement. Clin Cancer Res. 2003 Oct 1;9(12):4318–4323. - PubMed
-
- Miller AB, Hoogstraten B, Staquet M, Winkler A. Reporting results of cancer treatment. Cancer. 1981 Jan 1;47(1):207–214. - PubMed
-
- WHO handbook for reporting results of cancer treatment. Geneva (Switzerland): World Health Organization Offset Publication No. 48; 1979.
-
- Hopper KD, Kasales CJ, Van Slyke MA, Schwartz TA, TenHave TR, Jozefiak JA. Analysis of interobserver and intraobserver variability in CT tumor measurements. AJR Am J Roentgenol. 1996 Oct;167(4):851–854. - PubMed
Publication types
MeSH terms
Grants and funding
LinkOut - more resources
Full Text Sources
