Review
. 2009 Sep 15;877(26):2822-9.
doi: 10.1016/j.jchromb.2008.11.033. Epub 2008 Nov 28.

Direct profiling of tissue lipids by MALDI-TOFMS

Affiliations
Review

Direct profiling of tissue lipids by MALDI-TOFMS

Shelley N Jackson et al. J Chromatogr B Analyt Technol Biomed Life Sci. .

Abstract

Advances in matrix-assisted laser desorption/ionization time-of-flight mass spectrometry (MALDI-TOFMS) have allowed for the direct analysis of biological molecules from tissue. Although most of the early studies of direct tissue profiling by MALDI-TOFMS have focused on proteins and peptides, analysis of lipids has increased dramatically in recent years. This review gives an overview of the factors to consider when analyzing lipids directly from tissue and some recent examples of the use of MALDI-TOFMS for the direct profiling of lipids in tissue.


Figures
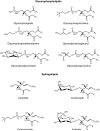
Fig. 1
Fig. 1
Major classes of glycerophospholipids and sphingolipids.
Fig. 2
Fig. 2
Comparison of mass spectral profiles from slices of fresh and fixed halves of the same bovine lens. The two mass spectra at top A and B correspond to the outermost region of the cortex. (A) Fresh tissue; (B) tissue fixed in 2.5% formaldehyde buffered solution (pH 7.4). The two mass spectra at the bottom were obtained from the nuclear region. (C) Fresh tissue; (D) fixed as in (B). The ratios of PCs to SMs at different locations in the lens are also labeled. Reprinted with permission from [44]. Copyright 2004 American Chemical Society.
Fig. 3
Fig. 3
MALDI/TOF-TOF product-ion spectra of (a) PC 32:0+H mass peak, (b) PC 32:0+K mass peak, and (c) PC 32:0+Li mass peak. (c) Reprinted with permission from [42]. Copyright 2005 Elsevier.
Fig. 4
Fig. 4
MALDI/TOF-TOF product-ion spectra of (a) PE 40:6a–H mass peak, (b) PI 38:4–H mass peak, and (c) PS 40:6–H mass peak. Reprinted with permission from [47]. Copyright 2007 Elsevier.
Fig. 5
Fig. 5
Overlay of two MALDI-IM 2D plots of the cerebral caudate-putamen region in rat brain tissue with DHB matrix without cesium (blue area) and with cesium (red area). Reprinted with permission from [74]. Copyright 2008 Elsevier (For interpretation of the references to color in this figure legend, the reader is referred to the web version of the article).
Fig. 6
Fig. 6
Comparison of (a) an optical image of a mouse brain section with three MALDI images of (b) m/z 760.6, (c) m/z 826.6, (d) m/z 834.6 from a corresponding mouse brain section in positive ion mode. Reprinted with permission from [37]. Copyright 2007 Elsevier.

Similar articles

Cited by

References

    1. Holthuis JCM, Levine TP. Nat. Rev. Mol. Cell Biol. 2005;6:209. - PubMed
    1. Watson AD. J. Lipid Res. 2006;47:2101. - PubMed
    1. van Meer G. EMBO J. 2005;24:3159. - PMC - PubMed
    1. Wenk MR. Nat. Rev. Drug Discov. 2005;7:594. - PubMed
    1. Piomelli D, Astarita G, Rapaka R. Nat. Rev. Neurosci. 2007;8:743. - PubMed

Publication types

MeSH terms

LinkOut - more resources