. 2009 Feb 20;284(8):4786-95.
doi: 10.1074/jbc.M808798200. Epub 2008 Dec 18.

Ceramide synthase inhibition by fumonisin B1 causes accumulation of 1-deoxysphinganine: a novel category of bioactive 1-deoxysphingoid bases and 1-deoxydihydroceramides biosynthesized by mammalian cell lines and animals

Affiliations

Ceramide synthase inhibition by fumonisin B1 causes accumulation of 1-deoxysphinganine: a novel category of bioactive 1-deoxysphingoid bases and 1-deoxydihydroceramides biosynthesized by mammalian cell lines and animals

Nicholas C Zitomer et al. J Biol Chem. .

Abstract

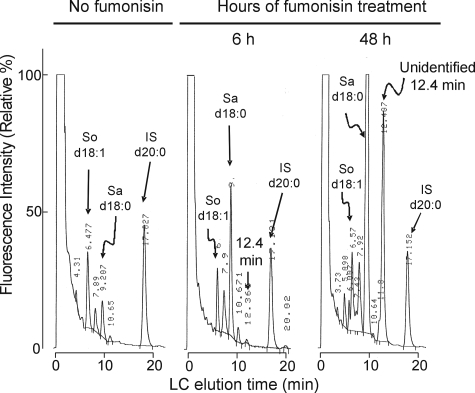
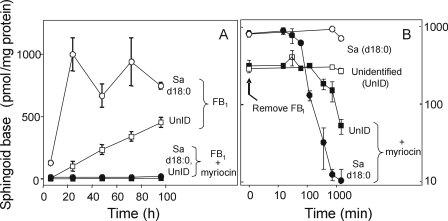
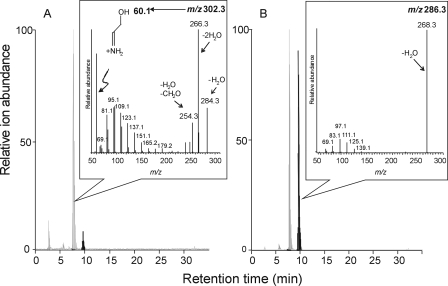
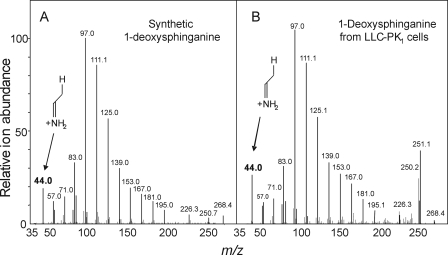
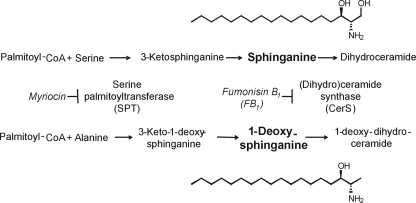
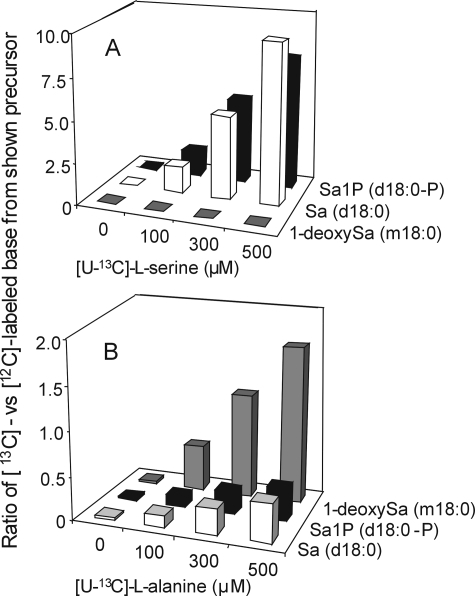
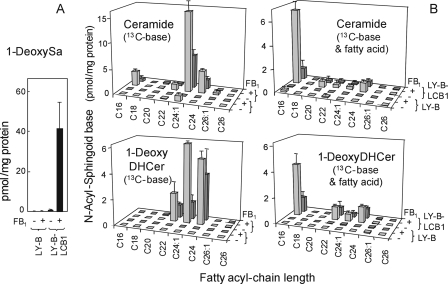
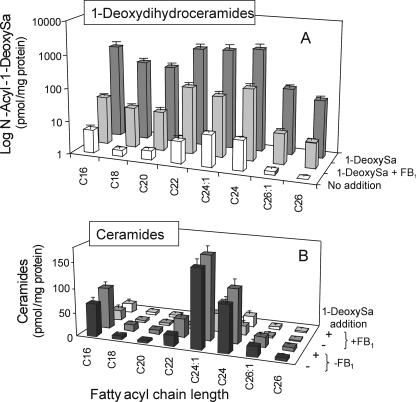
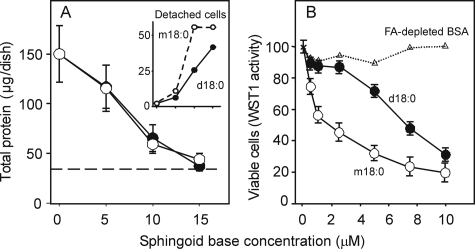
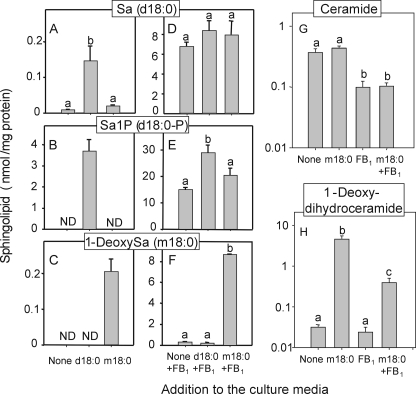
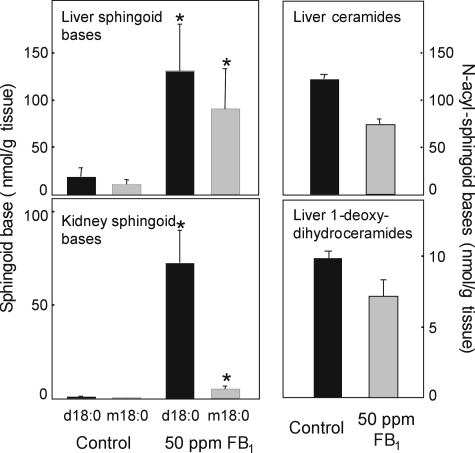
Fumonisin B(1) (FB(1)) is a mycotoxin that inhibits ceramide synthases (CerS) and causes kidney and liver toxicity and other disease. Inhibition of CerS by FB(1) increases sphinganine (Sa), Sa 1-phosphate, and a previously unidentified metabolite. Analysis of the latter by quadrupole-time-of-flight mass spectrometry assigned an m/z = 286.3123 in positive ionization mode, consistent with the molecular formula for deoxysphinganine (C(18)H(40)NO). Comparison with a synthetic standard using liquid chromatography, electrospray tandem mass spectrometry identified the metabolite as 1-deoxysphinganine (1-deoxySa) based on LC mobility and production of a distinctive fragment ion (m/z 44, CH(3)CH=NH (+)(2)) upon collision-induced dissociation. This novel sphingoid base arises from condensation of alanine with palmitoyl-CoA via serine palmitoyltransferase (SPT), as indicated by incorporation of l-[U-(13)C]alanine into 1-deoxySa by Vero cells; inhibition of its production in LLC-PK(1) cells by myriocin, an SPT inhibitor; and the absence of incorporation of [U-(13)C]palmitate into 1-[(13)C]deoxySa in LY-B cells, which lack SPT activity. LY-B-LCB1 cells, in which SPT has been restored by stable transfection, however, produce large amounts of 1-[(13)C]deoxySa. 1-DeoxySa was elevated in FB(1)-treated cells and mouse liver and kidney, and its cytotoxicity was greater than or equal to that of Sa for LLC-PK(1) and DU-145 cells. Therefore, this compound is likely to contribute to pathologies associated with fumonisins. In the absence of FB(1), substantial amounts of 1-deoxySa are made and acylated to N-acyl-1-deoxySa (i.e. 1-deoxydihydroceramides). Thus, these compounds are an underappreciated category of bioactive sphingoid bases and "ceramides" that might play important roles in cell regulation.


Figures

FIGURE 1.
FIGURE 1.
Representative chromatograms of lipid extracts from confluent cultures of LLC-PK1 cells treated with FB1 and analyzed by HPLC with fluorescence detection of the free sphingoid bases as the OPA derivatives using C20-Sa as an internal standard (26). In each case, the extracts were from ∼120 μg of total protein; the left chromatogram is for cells cultured in medium containing no FB versus cultures exposed to 50 μm FB1 for 6 (middle) and 48 h (right). Identifications are based on comparison with standards for So (d18:1), Sa (d18:0), and the added C20 Sa (d20:0) internal standard (IS). The unidentified species elutes at 12.4 min.
FIGURE 2.
FIGURE 2.
Changes in free Sa (d18:0) and the unidentified sphingoid base (UnID) in confluent cultures of LLC-PK1 cells treated with FB1 and/or myriocin. Panel A shows the amounts of these free sphingoid bases in cells exposed to 35 μm FB1 for various times (white circles and squares) or FB1 plus myriocin (black circles and squares). Panel B shows the reversibility of these elevations when LLC-PK1 cells were exposed for 48 h to FB1 followed by a change to fresh medium without FB1 (at time 0) but with (black circles and squares) or without myriocin (white circles and squares). The free sphingoid bases were analyzed by HPLC with fluorescence detection of the free sphingoid bases as OPA derivatives using C20-Sa (d20:0) as an internal standard (26). The data are the mean ± S.D. from three independent experiments.
FIGURE 3.
FIGURE 3.
Liquid chromatography of LLC-PK1 cell extracts after 24 h (A) and 120 h (B) of treatment with FB1 with monitoring for Sa and a novel sphingoid base by electrospray ionization tandem mass spectrometry. Free sphingoid bases were extracted from 100% confluent cultures (50–100μg of protein) using the method of Riley et al. (26) but without the addition of an internal standard. The chromatograms display the combined ion intensities for Sa (m/z 302.2, the gray major peak) and the unidentified sphingoid base (m/z 286.3, the black major peak), which eluted at retention times of ∼8 and 10 min, respectively. The insets are the product ion spectra for the eluted precursor m/z 302.2 (inset in A) and 286.3 (inset in B). Highlighted in A is a distinctive fragment for Sa (m/z 60. 1) that is not produced from m/z 286.3 (B).
FIGURE 4.
FIGURE 4.
Comparison of the MS3 spectra for synthetic 1-deoxySa (A) and the deoxySa isolated from LLC-PK1 cell extracts (B) using the method of Riley et al. (26) with subsequent partial purification on a minicolumn of preparative C18 packing material (5 mm × 60 mm); fractions enriched in the deoxySa were pooled for analysis. The samples were introduced into a Thermo Electron Corporation LTQ XL via syringe pump and scanned across the mass range shown for the MS3 fragments from the single dehydration product (m/z 268) of deoxySa. Highlighted is the distinctive fragment for 1-deoxySa at m/z 44.
FIGURE 5.
FIGURE 5.
Structures of Sa and 1-deoxySa and a scheme for the biosynthesis of 1-deoxySa and its accumulation in cells exposed to FB1. Also shown are the known sites of inhibition by FB1 and myriocin.
FIGURE 6.
FIGURE 6.
Incorporation of l-[U-13C]alanine (A) and l-[U-13C]serine precursors (B) into the 1-deoxySa (m18:0), Sa (d18:0), and Sa1P (d18:0-P) in Vero cells treated with 35 μm FB1 for 48 h and grown in medium containing increasing concentrations of either l-[U-13C]alanine- or l-[U-13C]serine(100 μm to 500 μm). The control (0) contained 35 μm FB1 and both [U-12C]alanine and [U-12C]serine were at 100 μm each. All other treatments contained both alanine and serine; however, while the concentration of l-[U-13C]alanine and l-[U-13C]serine ranged from 100 to 500 μm the other l-[12C]amino acid (alanine or serine) was maintained at 100 μm. Free sphingoid bases and sphingoid base 1-phosphates were extracted from the proliferating (50–80% confluent after 48 h) cultures (50–150 μg of protein) using the method of Zitomer et al. (27). The 13C-labeled deoxySa (m/z 288), Sa (m/z 304), Sa1P (m/z 384), and [12C, natural abundance 13C] species of 1-deoxySa (m/z 286), Sa (m/z 302), and Sa1P (m/z 382) were analyzed using LC ion trap-ESI-MS and the mean of the results from four replicate dishes are expressed as the ratio of the amount of 13C-labeled compound/12C-labeled compound. The standard deviations were all less than 5% of the mean values and are therefore not shown.
FIGURE 7.
FIGURE 7.
Absence of 1-deoxySa biosynthesis by LY-B cells and restoration of its formation in LY-B-LCB1 cells. Shown are the amounts of 1-[13C]deoxySa (panel A) and 13C-backbone-labeled ceramides and 1-deoxy-DHCer (panel B)(i.e. with [13C] in the backbone only: labeled 13C-base, or both the backbone and the fatty acid, labeled 13C-base & fatty acid) that are produced by LY-B and LY-B-LCB1 cells. The cells were incubated with 0.1 mm [U-13C]palmitate as the 1:1 complex with BSA for 24 h. For comparison with earlier findings with FB1 treatment, the indicated groups were also treated with 25 μm FB1. Then the sphingolipids were extracted and analyzed by LC-ESI-MS/MS as described under “Experimental Procedures.” Each treatment was conducted in triplicate, and the results shown are means ± S.D., n = 3.
FIGURE 8.
FIGURE 8.
Endogenous N-acyl-sphingoid bases in LLC-PK1 cells and after incubation of the cells with exogenously added 1-deoxySa with or without FB1. LLC-PK1 cells incubated for 48 h in growth medium supplemented with vehicle only, 10 μm 1-deoxySa, 50 μm FB1, or 10 μm 1-deoxySa plus 50 μm FB1 followed by analysis of the 1-deoxydihydroceramides (panel A) and ceramides (panel B) by LC ESI-MS/MS as described under “Experimental Procedures.” Each treatment was conducted in triplicate, and the results shown are means ± S.D., n = 3.
FIGURE 9.
FIGURE 9.
Effects of 1-deoxySa on LLC-PK1 and DU-145 cells. Panel A shows the decrease in cell growth and increase in detached cells in proliferating cultures of LLC-PK1 cells treated for 48 h with increasing concentrations of Sa (black circles, d18:0) or 1-deoxySa (white circles, m18:0) administered as the BSA complex. The values are the total protein content of the dishes (mean ± S.D., n = 3) at each concentration after 48 h. The dashed line is the average protein content (n = 3) of the dishes at the time (t = 0) that the treatment began. The inset shows the total protein content of detached cells expressed as a percentage of the total protein content of attached cells for each treatment. Detached cells were dead, based on their inability to exclude trypan blue. Panel B shows the effect on DU-145 cells as measured by the WST-1 cell proliferation assay with 100% reflecting the absorbance of the WST-1 reagent after incubation with the untreated DU-145 cells. Also shown are the results for dishes where BSA alone was added, triangles and dotted line. Each data point is the mean ± S.D. for three different wells.
FIGURE 10.
FIGURE 10.
Accumulation of Sa (A and D), Sa1P (B and E), 1-deoxySa (C and F), and decrease in ceramide (G) and change in 1-deoxydihydroceramide (H) levels in LLC-PK1 cells treated as described in Fig. 9 but only at the 10 μm concentration of Sa and 1-deoxySa (A–C) or in combination with 50 μm FB1 (D–F). Free sphingoid bases and sphingoid base 1-phosphates were extracted from the proliferating (50–90% confluent after 48 h) cultures (50–100 μg of protein) using the method of Zitomer et al. (27). The values are the means ± S.D. (n = 3 replicate 8-cm2 dishes). Mean values with differing letters are significantly different among groups based on one way analysis of variance; ND, not detected.
FIGURE 11.
FIGURE 11.
Accumulation of Sa (d18:0, black bars) and 1-deoxySa (m18:0, gray bars) in liver (upper) and kidneys (lower) of male P53N5-W mice fed a modified AIN-76A diet containing 0 ppm (Control) or 50 ppm FB1 for 6 months. Free sphingoid bases were extracted from liver and kidney homogenates (20 mg of fresh weight) and analyzed by the method of Zitomer et al. (27). Shown are means ± S.D. for five mice per group (n = 5); an asterisk (*) indicates that the mean is significantly (p < 0.05) elevated compared with the corresponding control group. Also shown are the total average amounts (± the range) of ceramides and 1-deoxydihydroceramides in livers from two mice in each group (right panels).

References

    1. Marasas, W. F. O. (2001) Environ. Health Perspect. 109 239–243 - PMC - PubMed
    1. Marasas, W. F. O., Riley, R. T., Hendricks, K. A., Stevens, V. L., Sadler, T. W., Gelineau-van Waes, J. B., Missmer, S. A., Cabrera, J., Torres, O., Gelderblom, W. C. A., Allgood, J., Martinez, C., Maddox, J., Miller, J. D., Starr, L., Sullards, M. C., Roman, A. V., Voss, K. A., Wang, E., and Merrill, A. H., Jr. (2004) J. Nutr. 134 711–716 - PubMed
    1. Voss, K. A., Riley, R. T., Norred, W. P., Bacon, C. W., Meredith, F. I., Howard, P. C., Plattner, R. D., Collins, T. F. X., Hansen, D. K., and Porter, J. K. (2001) Environ. Health Perspect. 109 259–266 - PMC - PubMed
    1. NTP Technical Report (2002). NIH Publication No. 99-3955
    1. Wang, E., Norred, W. P., Bacon, C. W., Riley, R. T., and Merrill, A. H., Jr. (1991) J. Biol. Chem. 266 14486–14490 - PubMed

Publication types

LinkOut - more resources