

Sonic hedgehog-responsive genes in the fetal prostate
- PMID: 19095649
- PMCID: PMC2645820
- DOI: 10.1074/jbc.M809172200
Sonic hedgehog-responsive genes in the fetal prostate
Abstract
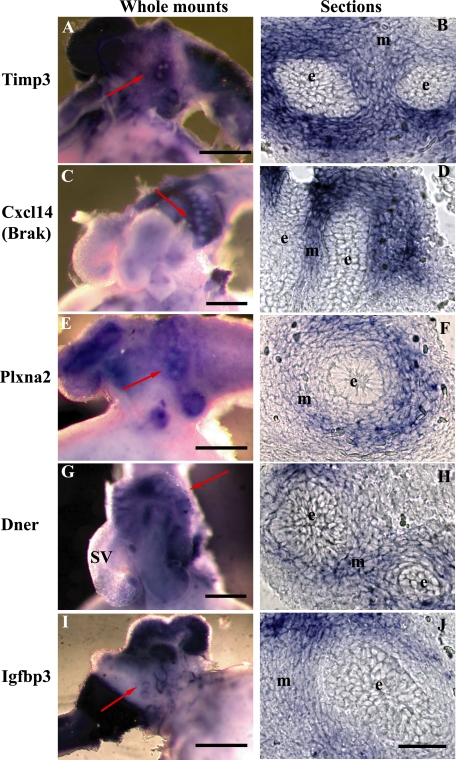
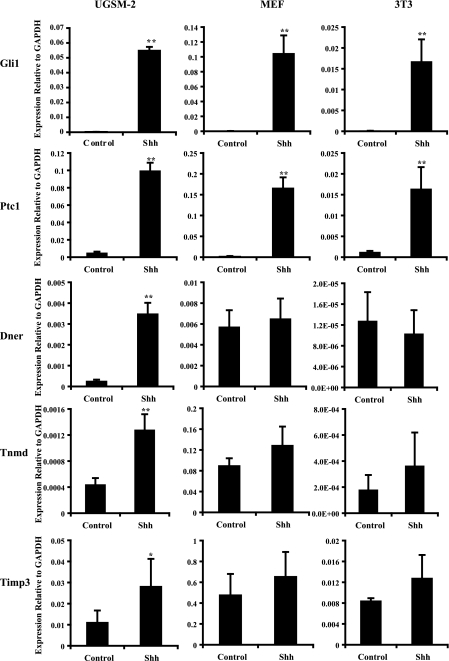
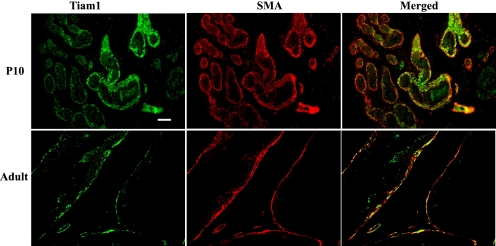
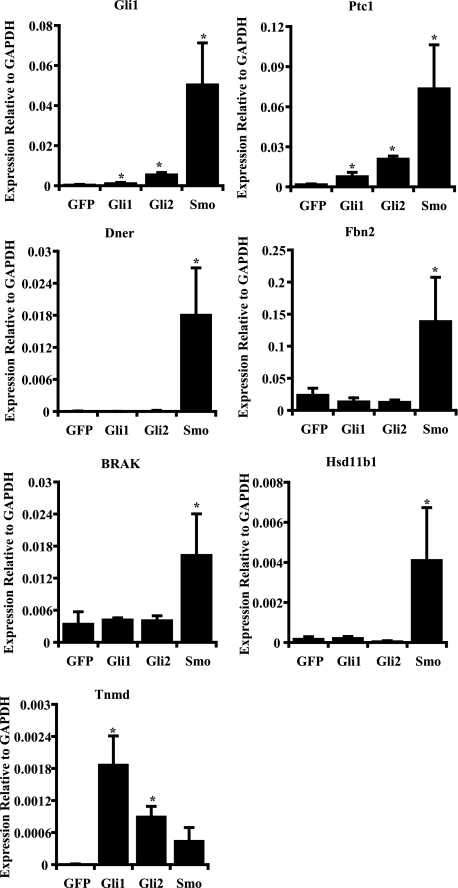
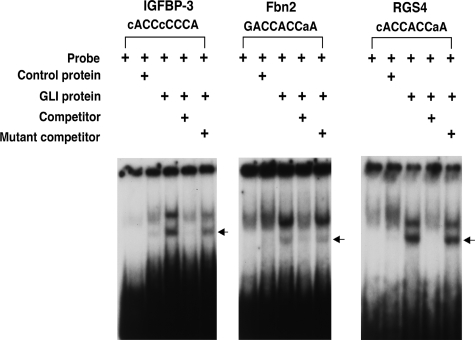
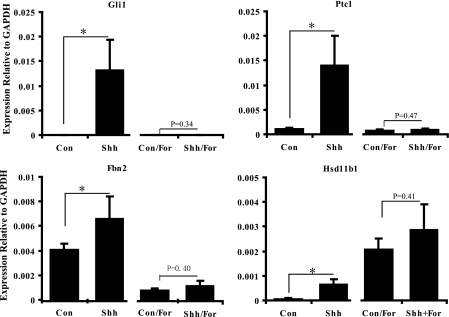
The Hedgehog (Hh) signaling pathway plays an important role in prostate development and appears to play an equally important role in promoting growth of advanced prostate cancer. During prostate development, epithelial cells in the urogenital sinus (UGS) express Sonic Hedgehog (Shh) and secrete Shh peptide. The secreted Hh peptide acts on adjacent mesenchymal cells to activate the Hh signal transduction pathway and elicit paracrine effects on epithelial proliferation and differentiation. To identify mesenchymal targets of Shh signaling, we performed microarray analysis on a Shh-responsive, immortalized urogential sinus mesenchymal cell line. We found 68 genes that were up-regulated by Shh and 21 genes that were down-regulated. Eighteen of those were selected for further study with Ptc1 and Gli1 serving as reference controls. We found 10 of 18 were also Hh-regulated in primary UGS mesenchymal cells and 13 of 18 in the cultured UGS. Seven of 18 exhibited Shh-regulated expression in both assays (Igfbp-6, Igfbp-3, Fbn2, Ntrk3, Agpt4, Dmp1, and Mmp13). Three of the 18 genes contained putative Gli binding motifs that bound Gli1 peptide in electrophoretic mobility shift assays. With the exception of Tiam1, target gene expression generally showed no differences in the concentration dependence of ligand-induced expression, but we observed strikingly different responses to direct pathway activation by transfection with activated Smo, Gli1, and Gli2.
Figures
References
-
- Ingham, P. W., and McMahon, A. P. (2001) Genes Dev. 15 3059–3087 - PubMed
-
- Podlasek, C. A., Barnett, D. H., Clemens, J. Q., Bak, P. M., and Bushman, W. (1999) Dev. Biol. 209 28–39 - PubMed
-
- Lamm, M. L., Catbagan, W. S., Laciak, R. J., Barnett, D. H., Hebner, C. M., Gaffield, W., Walterhouse, D., Iannaccone, P., and Bushman, W. (2002) Dev. Biol. 249 349–366 - PubMed
-
- Freestone, S. H., Marker, P., Grace, O. C., Tomlinson, D. C., Cunha, G. R., Harnden, P., and Thomson, A. A. (2003) Dev. Biol. 264 352–362 - PubMed
-
- Berman, D. M., Desai, N., Wang, X., Karhadkar, S. S., Reynon, M., Abate-Shen, C., Beachy, P. A., and Shen, M. M. (2004) Dev. Biol. 267 387–398 - PubMed
Publication types
MeSH terms
Substances
Grants and funding
LinkOut - more resources
Full Text Sources
Other Literature Sources
Miscellaneous
