. 2009 Feb;23(2):176-87.
doi: 10.1210/me.2008-0211. Epub 2008 Dec 18.

Estrogen-mediated suppression of the gene encoding protein tyrosine phosphatase PTPRO in human breast cancer: mechanism and role in tamoxifen sensitivity

Affiliations

Estrogen-mediated suppression of the gene encoding protein tyrosine phosphatase PTPRO in human breast cancer: mechanism and role in tamoxifen sensitivity

Bhuvaneswari Ramaswamy et al. Mol Endocrinol. 2009 Feb.

Abstract

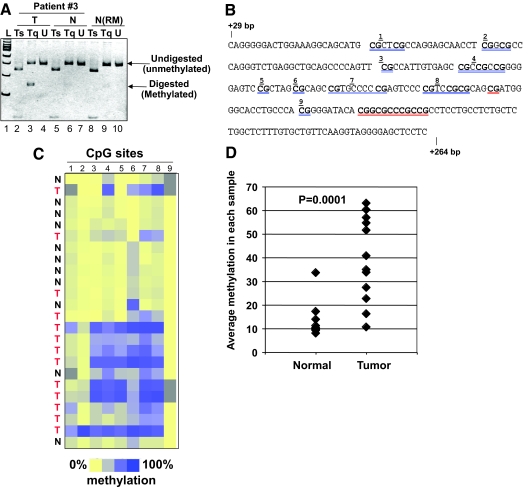
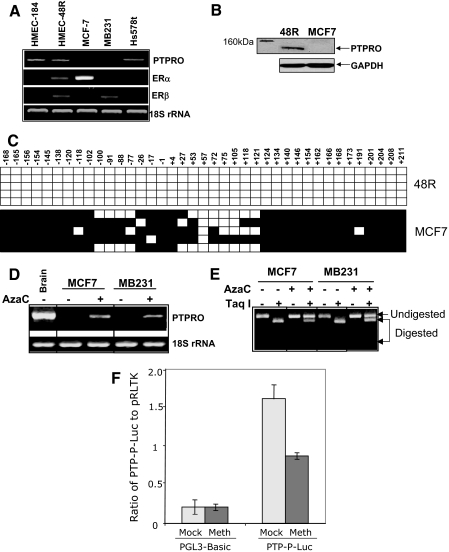
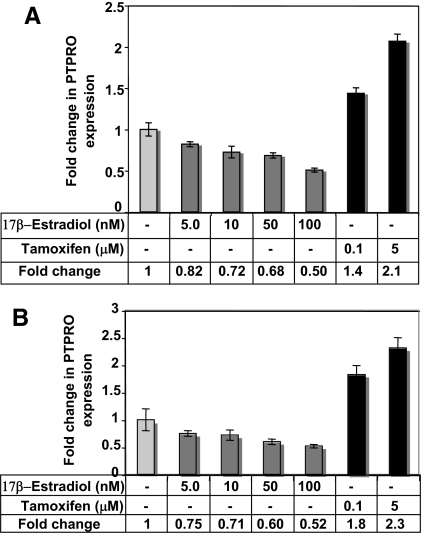
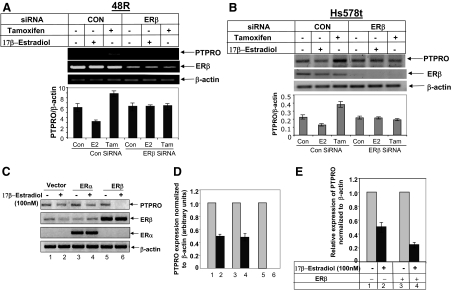
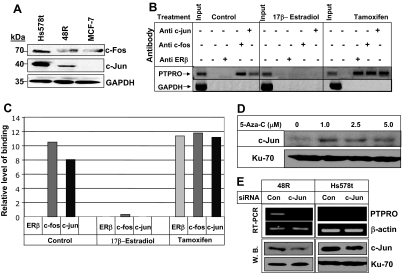
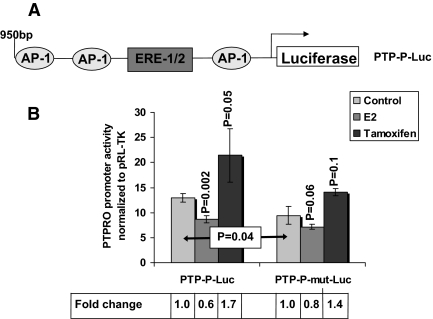
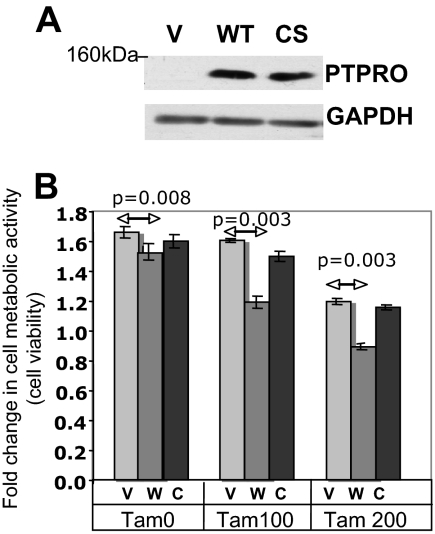
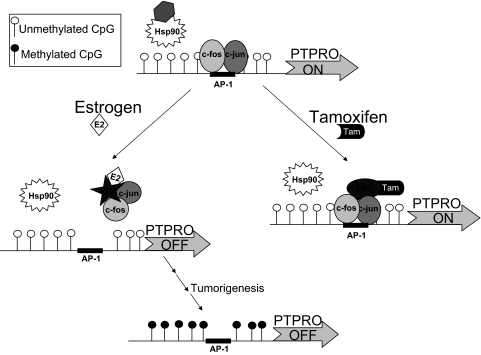
We have previously demonstrated the tumor suppressor characteristics of protein tyrosine phosphatase receptor-type O (PTPRO) in leukemia and lung cancer, including its suppression by promoter methylation. Here, we show tumor-specific methylation of the PTPRO CpG island in primary human breast cancer. PTPRO expression was significantly reduced in established breast cancer cell lines MCF-7 and MDA-MB-231 due to promoter methylation compared with its expression in normal human mammary epithelial cells (48R and 184). Further, the silenced gene could be demethylated and reactivated in MCF-7 and MDA-MB-231 cells upon treatment with 5-Azacytidine, a DNA hypomethylating agent. Because PTPRO promoter harbors estrogen-responsive elements and 17beta-estradiol (E2) plays a role in breast carcinogenesis, we examined the effect of E2 and its antagonist tamoxifen on PTPRO expression in human mammary epithelial cells and PTPRO-expressing breast cancer cell line Hs578t. Treatment with E2 significantly curtailed PTPRO expression in 48R and Hs578t cells, which was facilitated by ectopic expression of estrogen receptor (ER)beta but not ERalpha. On the contrary, treatment with tamoxifen increased PTPRO expression. Further, knockdown of ERbeta by small interfering RNA abolished these effects of E2 and tamoxifen. Chromatin immunoprecipitation assay showed association of c-Fos and c-Jun with PTPRO promoter in untreated cells, which was augmented by tamoxifen-mediated recruitment of ERbeta to the promoter. Estradiol treatment resulted in dissociation of c-Fos and c-Jun from the promoter. Ectopic expression of PTPRO in the nonexpressing MCF-7 cells sensitized them to growth-suppressive effects of tamoxifen. These data suggest that estrogen-mediated suppression of PTPRO is probably one of the early events in estrogen-induced tumorigenesis and that expression of PTPRO could facilitate endocrine therapy of breast cancer.


Figures

Figure 1
Figure 1
PTPRO CpG island is methylated in primary breast tumors. A, Genomic DNA isolated from primary breast tumor samples and matching adjacent normal tissue (n = 21) was subjected to COBRA. PCR-amplified PTPRO promoter fragment from a representative patient [no. 3; Tumor (T); and Normal (N)] and that from a normal individual (reduction mammoplasty, N-RM) were digested with Tsp509 I (Ts) or TaqI (Tq) or mock digested (U). The digested products were separated by polyacrylamide gel electrophoresis along side 100-bp ladder (L). B, MassARRAY, Sequence of PTPRO CpG island (+29 to +264) amplified for MassARRAY. Each individual or group of CpGs underlined in blue is represented by the corresponding number in the dendrogram in panel C. Data for the CpGs underlined in red could not be obtained due to low-/high-fragment mass. C, PTPRO CpG island amplified from BS-treated DNA of primary breast cancer samples (T) and normal adjacent tissue (N) were subjected to MassARRAY (EpiTYPER). Each square represents a single CpG or a group of two or three CpGs (see panel B) and each row represents a sample. Methylation frequency ranges from 0% (yellow) to 100% (dark blue). Gray indicates unavailable data. Samples include tumor (T) and normal (N) from breast cancer patients. D, Quantification of the EpiTYPER data as percent methylation of the PTPRO CpG island in tumor and normal tissues.
Figure 2
Figure 2
PTPRO is methylated in breast cancer cell lines but not in normal breast epithelial cells. A, Total RNA isolated from normal human mammary epithelial cells (48R, 184) and breast cancer cell lines Hs578t, MCF-7, and MB-231 were subjected to RT-PCR using PTPRO-, ERα-, ERβ-, or 18S rRNA (loading control)-specific primers. B, Whole-cell extracts from 48R and MCF-7 cells were subjected to Western blot analysis with PTPRO antibody (Abcam). The same blot was probed with anti-GAPDH antibody to ensure equal protein loading. C, PTPRO CpG island from HMEC 48R and MCF-7 cells was subjected to BS genomic sequencing. Each solid square represents a methylated cytosine and an open square represents unmethylated cytosine in a CpG dinucleotide context. Each row corresponds to a single clone. D, Breast cancer cell lines MCF-7 and MB-231 were treated with 1μm 5-AzaC for 72 h and 2.5 μm 5-AzaC for 96 h, respectively. Total RNA from cells was subjected to RT-PCR to amplify PTPRO mRNA. 18S rRNA was used as a normalizer. E, Genomic DNA isolated from untreated and 5-AzaC treated (5 μm for 2 wk) MCF-7 and MB-231 cells was subjected to COBRA with TaqI. The undigested and digested products indicate unmethylated and methylated DNA (at TaqI site, TCGA), respectively. To monitor DNA demethylation, cells were treated for longer time with the drug. F, H293t cells were transfected with mock-methylated (Mock) or HhaI-methylated (Meth) PTP-P-Luc plasmid. Luciferase activity was normalized to the internal control pRLTK. HhaI-methylated and mock-methylated pGL3-Basic was used as control. Error bars represent sd of triplicate measurements.
Figure 3
Figure 3
E2 inhibits and tamoxifen augments PTPRO expression in normal HMECs 48R and breast cancer cell line Hs578t. 48R (A) and Hs578t (B) cells were treated with indicated doses of E2 or tamoxifen for 72 h. Total RNA isolated from vehicle, E2, and tamoxifen-treated cells was subjected to real time RT-PCR with β-actin as normalizer for RNA input. The data are represented as fold change compared with control cells. Error bars represent sd of triplicate measurements.
Figure 4
Figure 4
ERβ mediates the effects of E2 and tamoxifen on PTPRO expression. 48R (panel A) or Hs578t cells (panel B) transiently transfected with either 100 nm control siRNA or ERβ siRNA were treated with either 100 nm E2, 5 μm tamoxifen (Tam), or left untreated. PTPRO expression analyzed by RT-PCR was normalized to β-actin. Error bars represent sd of triplicate measurements. C, Hs578t cells were transiently transfected with the vector alone, ERα expression vector, or ERβ expression vector. The transfected cells were treated with 100 nm E2 for 30 h. Total RNA isolated from these cells was subjected to RT-PCR with PTPRO-, ERα-, and ERβ-specific primers. β-actin was amplified to ensure equal input RNA. D, Quantification of the RT-PCR data. Error bars represent sd of triplicate measurements. E, 48R cells were transiently transfected with ERβ expression vector or the empty vector as indicated and treated with 100 nm E2 for 48 h. Total RNA was subjected to real-time RT-PCR for PTPRO expression. Normalized PTPRO expression in E2 untreated cells was assigned a value of 1.0. Error bars represent sd of triplicate measurements.
Figure 5
Figure 5
Differential association of AP-1 components and ERβ with the PTPRO promoter in the presence of E2 and tamoxifen. A, Whole-cell extracts from Hs578t, 48R, and MCF-7 cells were subjected to Western blot analysis with anti-c-Fos and anti-c-Jun antibody. The same blot was probed with anti-GAPDH antibody to ensure equal protein loading. B, Hs578t cells were treated with either 100 nm E2 or 5 μm tamoxifen for 24 h. Formaldehyde-cross-linked chromatin prepared from untreated or treated cells was immunoprecipitated with anti-ERβ, anti-c-Fos, or anti-c-Jun antibody. PTPRO promoter was amplified and analyzed from the pulled-down chromatin by semiquantitiative PCR. Amplification of GAPDH promoter was used as negative control. One representative sample of three repeats with similar observation is shown here. C, Quantification of binding observed in Fig. 5B is calculated as a percent of input DNA. D, MCF-7 cells were treated with increasing concentration of 5-AzaC for 72 h. Western blot analysis was performed with anti-c-Jun antibody, and the blot was reprobed with Ku-70 antibody for protein normalization. The data are representative of duplicate experiments. E, 48R and Hs578t cells were transfected with 100 nm c-Jun or control siRNA. PTPRO expression was analyzed by RT-PCR and normalized to β-actin expression. For c-Jun expression, whole-cell extract from siRNA-transfected cells was subjected to Western blot analysis with c-Jun antibody and normalized to Ku-70 protein. The data are representative of triplicate experiments. Con, Control; W.B., Western blot.
Figure 6
Figure 6
AP-1 site(s) are involved in the modulation of PTPRO expression. A, Schematic representation of the PTPRO promoter/luciferase reporter plasmid with relevant cis-regulatory elements (AP-1 and ERE) indicated. B, H293t cells were transiently transfected with PTP-P-Luc or PTP-P-mut-Luc (AP-1 site mutated to knock out c-Fos/c-Jun binding; Santa Cruz Biotechnology) and ERβ expression vector. Cells were treated with 100 nm E2, 5 μm tamoxifen, or the vehicle (EtOH) for 36 h before harvest. Luciferase activity was measured in the whole-cell lysate using the Dual Luciferase Assay System (Promega) and normalized to internal control pRL-TK. Any decrease in promoter activity due to E2 treatment or AP-1 mutation is calculated as percent reduction whereas an increase in promoter activity upon tamoxifen treatment is calculated as fold change over the untreated sample. For convenience, the reduction calculated as fold change is represented in the figure. P values were calculated using the Student’s t test.
Figure 7
Figure 7
PTPRO expression augments tamoxifen sensitivity of breast cancer cell line. A, The WT or CS mutant of FLAG-tagged PTPRO was overexpressed in MCF-7 cells. The G418 selected pool was analyzed by Western blot analysis for PTPRO overexpression using anti-FLAG M2 antibody. B, The PTPRO overexpressing pool (WT and CS mutant) cells were treated with 0, 100, and 200 nm tamoxifen. Cell viability was measured using MTT assay at 0 and 48 h. The data are represented as fold change in metabolic activity at 48 h compared with activity at 0 h. Error bars represent sd of triplicate measurements. Tam0, Tam100, Tam200, 0, 100, and 200 nm tamoxifen; V, vector; W, wild type; C, catalytic site mutant.
Figure 8
Figure 8
Schematic model of PTPRO gene regulation by estrogen and tamoxifen in breast epithelial cells. c-Fos- and c-Jun-mediated expression of PTPRO via AP-1 site is further activated in presence of tamoxifen and inhibited by estrogen in the presence of ERβ. The transcriptional repression of PTPRO in the presence of estrogen, as observed in mammary epithelial cells, could probably lead to CpG island methylation probably during the multistep process of tumorigenesis. Hsp90, Heat shock protein 90; Tam, tamoxifen.

Similar articles

Cited by

References

    1. Russo J, Hu YF, Yang X, Russo IH 2000 Developmental, cellular, and molecular basis of human breast cancer. J Natl Cancer Inst Monogr:17–37 - PubMed
    1. Peppercorn J, Perou CM, Carey LA 2008 Molecular subtypes in breast cancer evaluation and management: divide and conquer. Cancer Invest 26:1–10 - PubMed
    1. Perou CM, Sorlie T, Eisen MB, van de Rijn M, Jeffrey SS, Rees CA, Pollack JR, Ross DT, Johnsen H, Akslen LA, Fluge O, Pergamenschikov A, Williams C, Zhu SX, Lonning PE, Borresen-Dale AL, Brown PO, Botstein D 2000 Molecular portraits of human breast tumours. Nature 406:747–752 - PubMed
    1. Henderson BE, Feigelson HS 2000 Hormonal carcinogenesis. Carcinogenesis 21:427–433 - PubMed
    1. Kuiper GG, Enmark E, Pelto-Huikko M, Nilsson S, Gustafsson JA 1996 Cloning of a novel receptor expressed in rat prostate and ovary. Proc Natl Acad Sci USA 93:5925–5930 - PMC - PubMed

Publication types

MeSH terms