. 2009 Jan;174(1):34-43.
doi: 10.2353/ajpath.2009.080650. Epub 2008 Dec 18.

The Krebs cycle and mitochondrial mass are early victims of endothelial dysfunction: proteomic approach

Affiliations

The Krebs cycle and mitochondrial mass are early victims of endothelial dysfunction: proteomic approach

Francesco Addabbo et al. Am J Pathol. 2009 Jan.

Erratum in

  • Am J Pathol. 2009 Mar;174(3):1120.. Ciszar, Anna [corrected to Csiszar, Anna]; Krasnikof, Boris [corrected to Krasnikov, Boris]

Abstract

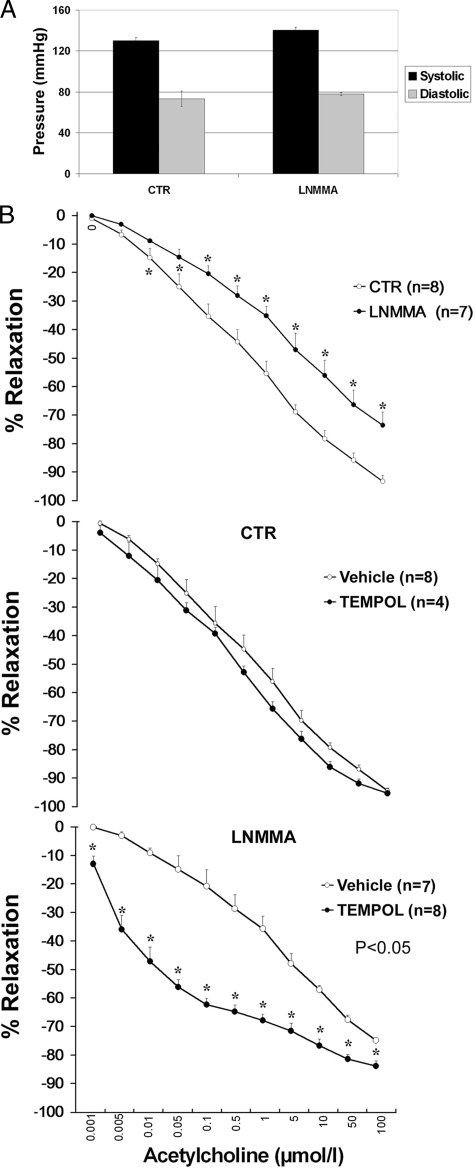
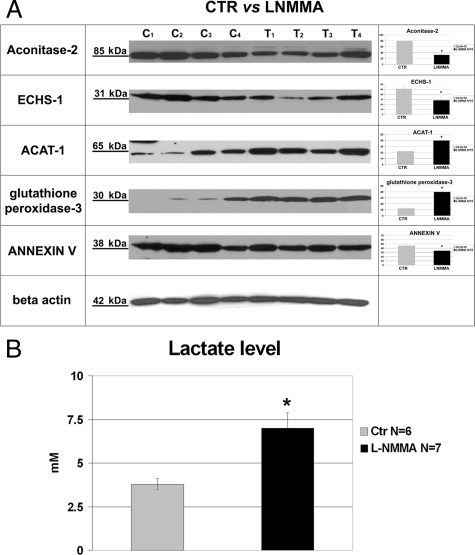
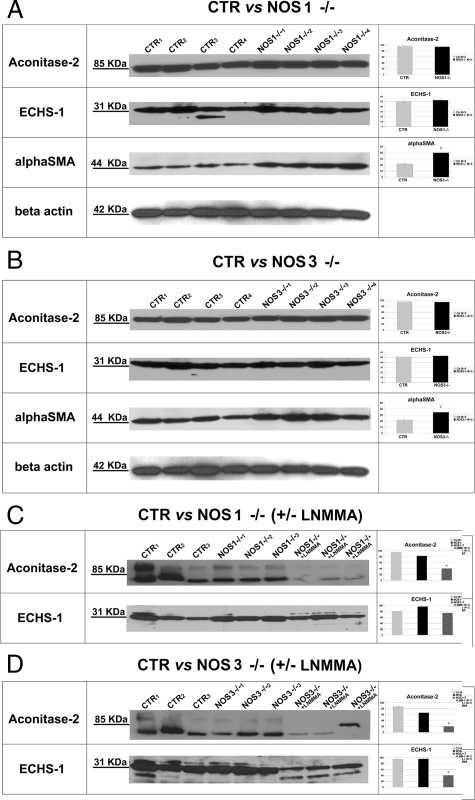
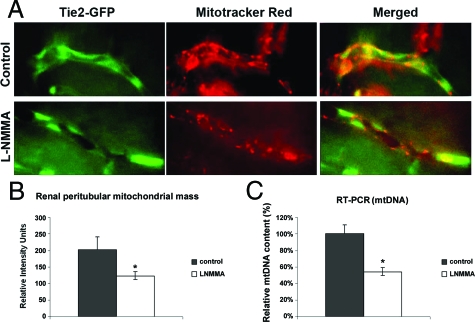
Endothelial cell dysfunction is associated with bioavailable nitric oxide deficiency and an excessive generation of reactive oxygen species. We modeled this condition by chronically inhibiting nitric oxide generation with subpressor doses of N(G)-monomethyl-L-arginine (L-NMMA) in C57B6 and Tie-2/green fluorescent protein mouse strains. L-NMMA-treated mice exhibited a slight reduction in vasorelaxation ability, as well as detectable abnormalities in soluble adhesion molecules (soluble intercellular adhesion molecule-1 and vascular cellular adhesion molecule-1, and matrix metalloproteinase 9), which represent surrogate indicators of endothelial dysfunction. Proteomic analysis of the isolated microvasculature using 2-dimensional gel electrophoresis and matrix-assisted laser desorption/ionization time-of-flight mass spectroscopy revealed abnormal expression of a cluster of mitochondrial enzymes, which was confirmed using immunodetection. Aconitase-2 and enoyl-CoA-hydratase-1 expression levels were decreased in L-NMMA-treated animals; this phenotype was absent in nitric oxide synthase-1 and -3 knockout mice. Depletion of aconitase-2 and enoyl-CoA-hydratase-1 resulted in the inhibition of the Krebs cycle and enhanced pyruvate shunting toward the glycolytic pathway. To assess mitochondrial mass in vivo, co-localization of green fluorescent protein and MitoTracker fluorescence was detected by intravital microscopy. Quantitative analysis of fluorescence intensity showed that L-NMMA-treated animals exhibited lower fluorescence of MitoTracker in microvascular endothelia as a result of reduced mitochondrial mass. These findings provide conclusive and unbiased evidence that mitochondriopathy represents an early manifestation of endothelial dysfunction, shifting cell metabolism toward "metabolic hypoxia" through the selective depletion of both aconitase-2 and enoyl-CoA-hydratase-1. These findings may contribute to an early preclinical diagnosis of endothelial dysfunction.


Figures

Figure 1
Figure 1
Characterization of the model of mild chronic NOS inhibition in mice. A: Preservation of blood pressure control in L-NMMA-treated mice. L-NMMA was administered with the drinking water at concentration of 0.3 mg/ml. B: A modest defect in acetylcholine-induced vasorelaxation of aortic rings in L-NMMA-treated mice. Data represent a cumulative dose-response analysis of aortic relaxation (concentration of acetylcholine is shown in abscissa). *statistically significant differences from control.
Figure 2
Figure 2
Proteomic analysis of microvasculature obtained from control and L-NMMA-treated mice. A: A representative image of a vascular tree used for analyses. B,C: DIGE-resolved proteins and their abundance in control and experimental vessels respectively. Image scans of differentially expressed spots were performed using Typhoon TRIO (Amersham BioSciences, Piscataway, NJ) and subjected to in-gel analysis and cross-gel analysis using DeCyder software version 6.0 (Amersham BioSciences). The volume ratio change of the protein differential expression was obtained from in-gel DeCyder software analysis. Reported values are expressed as mean ± SD computed from a total of two analytical and one preparative 2D-DIGE.
Figure 3
Figure 3
Validation of the DIGE results: Western blot analysis of selected proteins. A: Representative Immunodetection of mitochondrial aconitase-2, ECHS-1, ACAT-1, glutathione peroxidase-3, and Annexin-V in individual microvascular trees of control (C1–C4) and L-NMMA-treated mice (T1–T4). Accordingly with 2D-DIGE, treated animals showed a reduced abundance of mitochondrial Aconitase-2 (80.8 ± 7.4 vs. 33.8 ± 6.1, controls versus L-NMMA treated respectively), ECHS-1 (51.9 ± 8.2 vs. 28.8 ± 6.2), and Annexin-V (47.2 ± 5.0 vs. 32.6 ± 5.9). Analysis showed an increased abundance of ACAT-1 (23.7 ± 5.0 vs. 39.4 ± 4.6) and Glutathione peroxidase 3 (12.2 ± 2.4 vs. 40.6 ± 4.4). Right-hand bar diagrams summarize densitometric analysis of individual proteins normalized for β-Actin abundance (N = 10 samples per group). Values are expressed in arbitrary units as means ± SD. *P < 0.05 vs. control. B: Lactate level in control and L-NMMA-treated mice. *P < 0.05 vs. control.
Figure 4
Figure 4
Equal expression of eNOS and trace amounts of vimentin in microvasculature of control and L-NMMA-treated mice.
Figure 5
Figure 5
A, B: Representative immunodetection of mitochondrial aconitase-2, ECHS-1, and anti-α-smooth muscle actin in microvascular trees obtained from NOS1−/− and NOS-3−/− mice. C, D: Immunodetection of Aconitase-2 and ECHS-1 in NOS1−/− and NOS3−/− mice ± L-NMMA treatment. Right-hand bar diagrams summarize densitometric analysis of individual proteins normalized for β-actin abundance. *P < 0.05 vs. control.
Figure 6
Figure 6
Intravital videomicroscopy of renal peritubular capillaries loaded with the MitoTracker in Tie-2/GFP mice. A: Consecutive images of GFP (left panels) and MitoTracker (middle panels) fluorescence, and the merged image (right panels). B: Quantitative pixel analysis of MitoTracker fluorescence in control and L-NMMA-treated mice.C: Quantitative RT-PCR for mitochondrial DNA. Data are expressed as percentage change, values are normalized to control mean. *P < 0.05.
Figure 7
Figure 7
Functional proof of mitochondriopathy and reliance on glycolysis for cell survival—d-glucose-to-galactose switch. A: The rate of apoptosis in endothelial cells cultured for 4 days in Dulbecco’s Modified Eagle’s Medium containing either d-glucose or galactose. B: The rate of senescence in endothelial cell after culture for 4 days in Dulbecco’s Modified Eagle’s Medium containing either d-glucose or galactose. *P < 0.05, **P < 0.01.

References

    1. Koenig W. Cardiovascular biomarkers: added value with an integrated approach? Circulation. 2007;116:3–5. - PubMed
    1. Khot UN, Khot MB, Bajzer CT, Sapp SK, Ohman EM, Brener SJ, Ellis SG, Lincoff AM, Topol EJ. Prevalence of conventional risk factor in patient with coronary heart disease. JAMA. 2003;290:898–904. - PubMed
    1. Lowell BB, Shulman GI. Mitochondrial dysfunction and type 2 diabetes. Science. 2005;307:384–387. - PubMed
    1. Vasan RS. Biomarkers of cardiovascular disease: molecular basis and practical considerations. Circulation. 2006;113:2335–2362. - PubMed
    1. Karra R, Vemullapalli S, Dong C, Herderick EE, Song X, Slosek K, Nevins JR, West M, Goldschmidt-Clermont PJ, Seo D. Molecular evidence for arterial repair in atherosclerosis. Proc Natl Acad Sci USA. 2005;102:16789–16794. - PMC - PubMed

Publication types

MeSH terms