Comparative Study
. 2008;122(2):110-21.
doi: 10.1159/000163088. Epub 2008 Dec 18.

A genome assembly-integrated dog 1 Mb BAC microarray: a cytogenetic resource for canine cancer studies and comparative genomic analysis

Affiliations
Comparative Study

A genome assembly-integrated dog 1 Mb BAC microarray: a cytogenetic resource for canine cancer studies and comparative genomic analysis

R Thomas et al. Cytogenet Genome Res. 2008.

Abstract

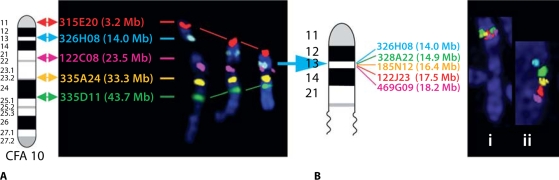
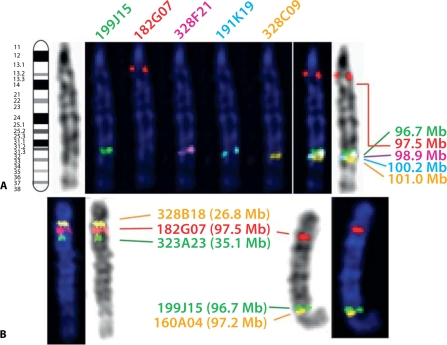
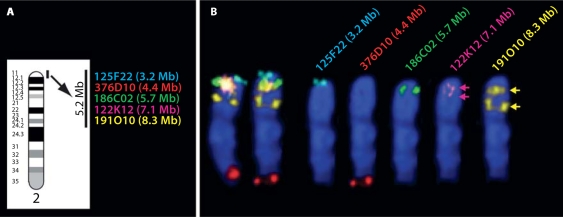
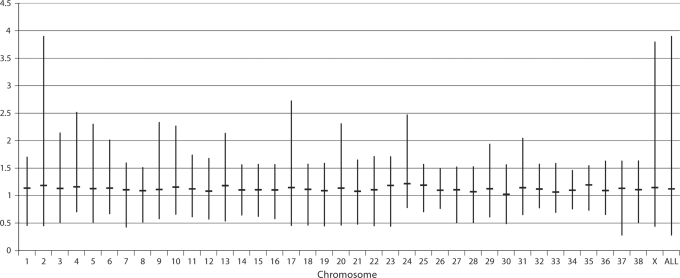
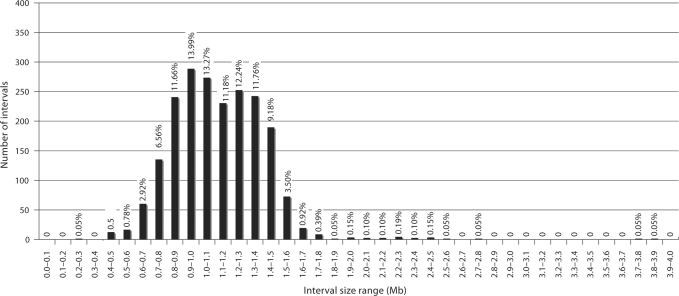
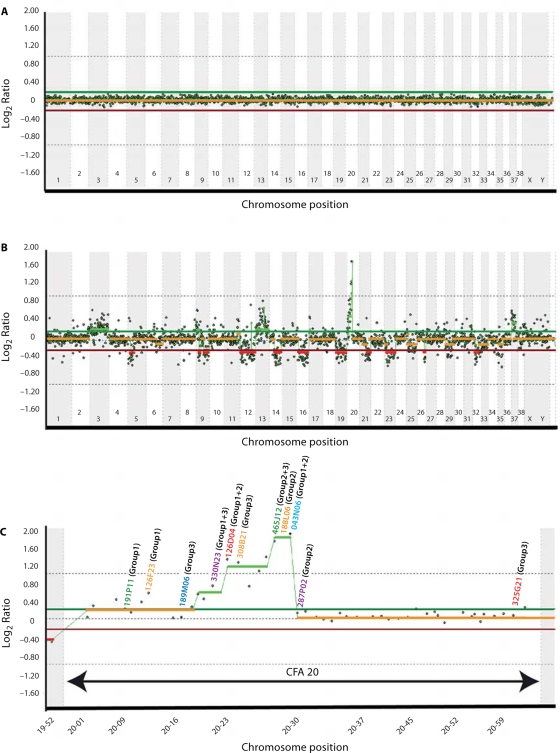
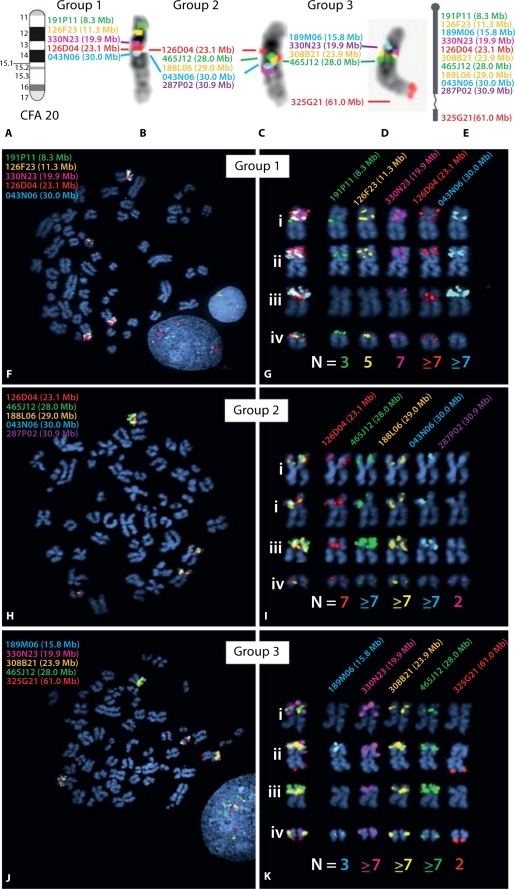
Molecular cytogenetic studies have been instrumental in defining the nature of numerical and structural chromosome changes in human cancers, but their significance remains to be fully understood. The emergence of high quality genome assemblies for several model organisms provides exciting opportunities to develop novel genome-integrated molecular cytogenetic resources that now permit a comparative approach to evaluating the relevance of tumor-associated chromosome aberrations, both within and between species. We have used the dog genome sequence assembly to identify a framework panel of 2,097 bacterial artificial chromosome (BAC) clones, selected at intervals of approximately one megabase. Each clone has been evaluated by multicolor fluorescence in situ hybridization (FISH) to confirm its unique cytogenetic location in concordance with its reported position in the genome assembly, providing new information on the organization of the dog genome. This panel of BAC clones also represents a powerful cytogenetic resource with numerous potential applications. We have used the clone set to develop a genome-wide microarray for comparative genomic hybridization (aCGH) analysis, and demonstrate its application in detection of tumor-associated DNA copy number aberrations (CNAs) including single copy deletions and amplifications, regional aneuploidy and whole chromosome aneuploidy. We also show how individual clones selected from the BAC panel can be used as FISH probes in direct evaluation of tumor karyotypes, to verify and explore CNAs detected using aCGH analysis. This cytogenetically validated, genome integrated BAC clone panel has enormous potential for aiding gene discovery through a comparative approach to molecular oncology.


Figures

Fig. 1
Fig. 1
FISH analysis of clones from CFA10. (A) The chromosome location of five differentially labeled clones from the previously reported 10 Mb resolution dog BAC set (Thomas et al., 2007), starting with the most centromeric clone. The text color indicates the fluorochrome with which each clone was labeled for FISH analysis, and the Mb position on CFA10 is shown after the corresponding BAC address. To the left is the CFA10 ideogram, and to the right, three examples of these five probes hybridized to CFA10 at increasingly later stages of metaphase. Accurate assignment of clones at 10 Mb resolution is clearly possible in early metaphase, and probe order is easily ascertained. (B) Five probes at intervals of approximately 1 Mb, starting from the second clone in the previous 10 Mb set (326H08). In metaphase (Bi) these five probes at 1 Mb intervals can be accurately assigned to a chromosome band, but their relative order cannot be readily resolved due to extensive chromosome contraction. Accurate ordering is thus reliant on interphase mapping (Bii).
Fig. 2
Fig. 2
Use of FISH analysis to resolve mapping anomalies. Clone 182G07 (CFA1; 97.5 Mb) mapped by FISH analysis to a site significantly more proximal to that suggested by the genome assembly (A). Co-hybridization of this BAC with two clones from this more proximal region of CFA1 resolved the location of 182G07 to approximately CFA1; 30 Mb (B, left image), whilst the gap left by this clone was successfully filled by clone 160A04 (CFA1; 97.2 Mb), selected from the assembly (B, right image). Using the same strategy, the location of clone 307O16 (CFA6; 61.9 Mb) was revised to a more proximal location (CFA6; 45 Mb, data not shown) and the consequent gap was filled successfully by clone 502O13 (CFA6; 62.0 Mb).
Fig. 3
Fig. 3
FISH analysis of five BAC clones from the CFA2qcen region of the genome assembly. The five most proximal clones selected for analysis in phase I are shown in A against the ideogram of CFA2, spanning a 5.2 Mb region of the genome assembly. (B) Left, the composite results of FISH analysis of these clones on both CFA2 homologues from one cell and right, the five separate planes of fluorescent signal corresponding to each differentially labeled clone are shown individually for one of these homologues. Two clones (125F22 and 186C02) showed unique signal in the expected chromosome location. Clones 122K12 and 191O10 also mapped where expected, but showed additional hybridization sites further down the chromosome, which were of equal strength to the primary signal. These pairs of probe signals (arrowed) suggested the presence of tandem repeat sequences in this region of CFA2, which was supported by the identification of a similar pattern of results for the next distal marker from this region (199D17, CFA2; 8.9 Mb, data not shown). Clones distal to this marker mapped to the expected unique location, thus the region of repetitive sequence appears to extend to approximately 9 Mb from the start of the CFA2 assembly. Note that clone 376D10 (CFA2; 4.3 Mb according to the assembly) mapped significantly more distally than expected, close to the CFA2 telomere. Through co-hybridization of 376D10 with clones from this region (following the strategy outlined in Fig. 2), the cytogenetic location of this BAC was resolved to approximately CFA2; 87 Mb. This finding was subsequently attributed to misplacement of one end of the BAC clone sequence at CFA2; 4.3 Mb, most likely due to the presence of repetitive sequence, whilst the other end was correctly positioned at CFA2; 86.7 Mb.
Fig. 4
Fig. 4
Distance between consecutive clones from the optimized 1 Mb clone set on each dog chromosome. The top and bottom of each vertical bar indicate the maximum and minimum interval respectively (in Mb) in the optimized clone panel for each chromosome. The horizontal line bisecting each bar shows the mean interval size on that chromosome. The final bar summarizes interval data for the whole genome, demonstrating the mean genome-wide interval of 1.12 Mb. Note the large maximum interval encountered on CFA2, which is a consequence of the inability to identify BAC clones with unique FISH signals due to the presence of highly repetitive DNA sequence near the centromere. The large maximum interval for CFAX is due to under-representation of the CFAX centromere in the dog genome sequence, which is also attributed to extensive tracts of repetitive sequence in this region.
Fig. 5
Fig. 5
Distribution of intervals between consecutive clones from the optimized 1 Mb clone set. Vertical bars show the number of intervals within the Mb size ranges indicated on the x-axis. The percentage of intervals in each size range is shown above the corresponding bar, showing that 94.4% of clones map at intervals ≤1.5 Mb.
Fig. 6
Fig. 6
Whole genome aCGH profiles obtained using the 1 Mb assembly-integrated dog BAC array, showing composite dye-swapped array CGH profiles of (A) a self-self hybridization of differentially labeled male reference DNA and (B) a DNA sample derived from a canine histiocytic tumor co-hybridized with reference DNA. Data are plotted as the median, block-normalized and background-subtracted log2 ratio of the replicate spots for each BAC clone on the 1 Mb array. Log2 ratios representing genomic gain and loss are indicated by horizontal bars above (green line) and below (red line) the midline (orange line) representing normal copy number. The aCGH profile in A shows that the copy number status throughout the genome is reported as normal, as expected for a self-self hybridization. In B this chromosome copy-number status line appears as either red or green in regions where genomic imbalances were apparent (red = loss, green = gain), as determined by the aCGH Smooth algorithm (Jong et al., 2004). The profile indicates whole chromosome gain for CFA3, CFA13 and CFA37, and a high level amplification on CFA20. Genomic losses were detected on CFA5, CFA9, CFA12, CFA14, CFA16, CFA19, CFA21, CFA23, CFA26 and CFA32. The amplification on CFA20 is enlarged to show more detail in C, depicting the copy number ratio for all clones distributed along this chromosome. A subset of these clones (indicated on the CFA20 profile in C) was subsequently used as SLPs for FISH analysis of tumor chromosomes. The color of the text used for each clone address corresponds to the fluorochrome with which it was labeled, and the number shown against each clone address shows which clones were grouped together in FISH analysis (see Fig. 7A–E for details).
Fig. 7
Fig. 7
Targeted FISH analysis of CFA20 in the dog histiocytic sarcoma case, using clones from the 1 Mb array. Based on results of aCGH analysis, a panel of 11 BAC clones was selected for detailed characterization of copy number status along CFA20. Probes were combined into three groups of five differentially-labeled probes for FISH analysis (with four probes represented twice). All clones were hybridized onto normal metaphase chromosome preparations from a clinically healthy donor, to confirm the expected probe location relative to the CFA20 ideogram (Fig. 5A). The resulting images of probe signals on normal banded chromosomes are shown in B–D, and these data are summarized schematically in E. The text color corresponds to the fluorochrome with which each BAC probe was labeled, and the Mb position of each clone on CFA20 is also shown. (F–K) Results of FISH analysis using the same three groups of BAC clones on the histiocytic sarcoma case. These data demonstrate four distinct chromosome structures harboring regions corresponding to CFA20, each with a different morphology and probe hybridization profile. These four structures comprised two metacentric chromosomes, one sub-metacentric chromosome and one small acrocentric chromosome whose SLP profile was consistent with that of a grossly normal CFA20. The modal copy number for each probe in all cells analyzed is shown below the corresponding chromosome structure. Note that assessment of copy number status is challenging for probes showing high level amplifications, since apparent tandem duplications often result in large probe signals that cannot be resolved fully even in interphase preparations. Modal copy numbers are therefore based on analysis of both metaphase and interphase chromosomes from >30 cells in each instance.

Similar articles

Cited by

References

    1. Backx L, Van Esch H, Melotte C, Kosyakova N, Starke H, et al. Array painting using microdissected chromosomes to map chromosomal breakpoints. Cytogenet Genome Res. 2007;116:158–166. - PubMed
    1. Barrans SL, Fenton JA, Banham A, Owen RG, Jack AS. Strong expression of FOXP1 identifies a distinct subset of diffuse large B-cell lymphoma (DLBCL) patients with poor outcome. Blood. 2004;104:2933–2935. - PubMed
    1. Breen M, Modiano JF. Evolutionarily conserved cytogenetic changes in hematological malignancies of dogs and humans – man and his best friend share more than companionship. Chromosome Res. 2008;16:145–154. - PubMed
    1. Breen M, Bullerdiek J, Langford CF. The DAPI banded karyotype of the domestic dog (Canis familiaris) generated using chromosome-specific paint probes. Chromosome Res. 1999a;7:401–406. - PubMed
    1. Breen M, Thomas R, Binns MM, Carter NP, Langford CF. Reciprocal chromosome painting reveals detailed regions of conserved synteny between the karyotypes of the domestic dog (Canis familiaris) and human. Genomics. 1999b;61:145–155. - PubMed

Publication types