. 2008;3(12):e3984.
doi: 10.1371/journal.pone.0003984. Epub 2008 Dec 19.

Never resting brain: simultaneous representation of two alpha related processes in humans

Affiliations

Never resting brain: simultaneous representation of two alpha related processes in humans

Eti Ben-Simon et al. PLoS One. 2008.

Abstract

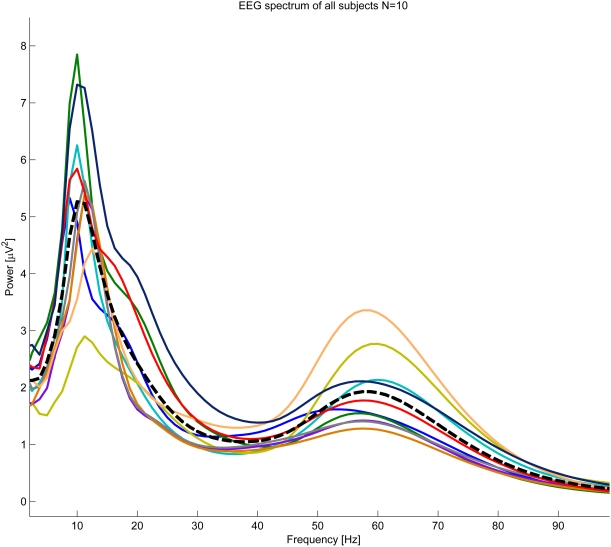
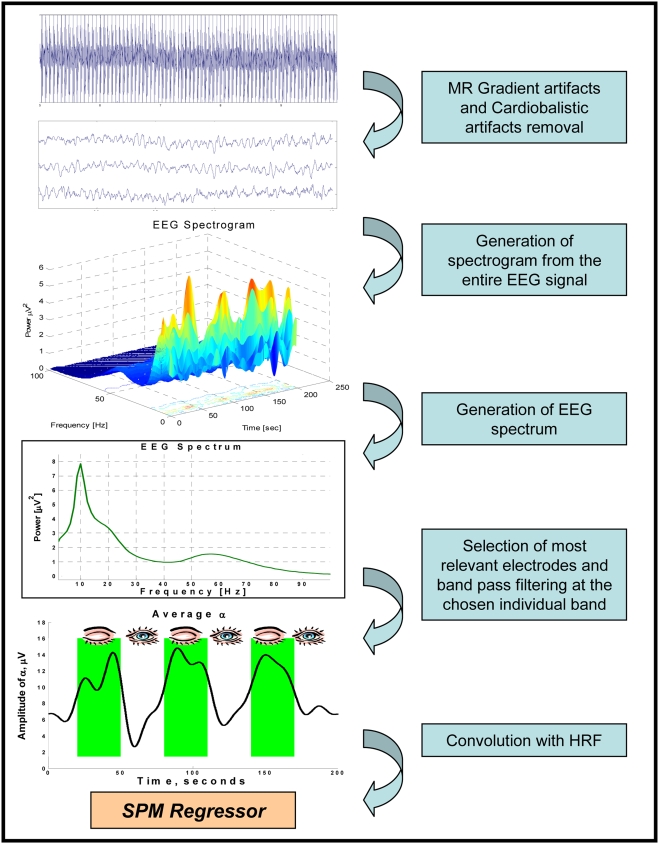
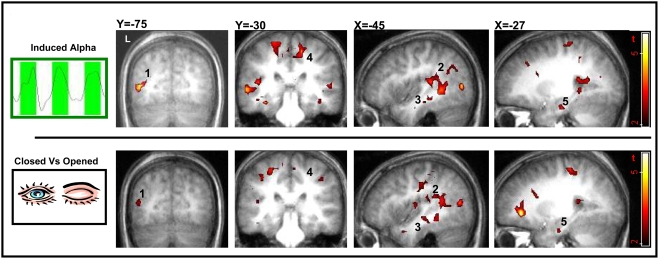
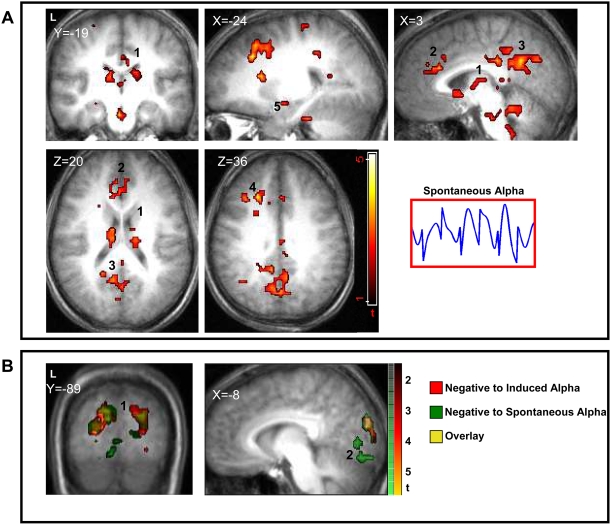
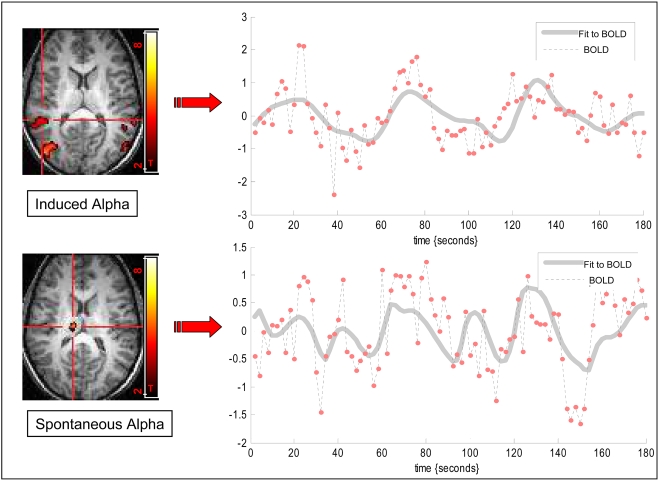
Brain activity is continuously modulated, even at "rest". The alpha rhythm (8-12 Hz) has been known as the hallmark of the brain's idle-state. However, it is still debated if the alpha rhythm reflects synchronization in a distributed network or focal generator and whether it occurs spontaneously or is driven by a stimulus. This EEG/fMRI study aimed to explore the source of alpha modulations and their distribution in the resting brain. By serendipity, while computing the individually defined power modulations of the alpha-band, two simultaneously occurring components of these modulations were found. An 'induced alpha' that was correlated with the paradigm (eyes open/ eyes closed), and a 'spontaneous alpha' that was on-going and unrelated to the paradigm. These alpha components when used as regressors for BOLD activation revealed two segregated activation maps: the 'induced map' included left lateral temporal cortical regions and the hippocampus; the 'spontaneous map' included prefrontal cortical regions and the thalamus. Our combined fMRI/EEG approach allowed to computationally untangle two parallel patterns of alpha modulations and underpin their anatomical basis in the human brain. These findings suggest that the human alpha rhythm represents at least two simultaneously occurring processes which characterize the 'resting brain'; one is related to expected change in sensory information, while the other is endogenous and independent of stimulus change.


Conflict of interest statement

Competing Interests: The authors have declared that no competing interests exist.

Figures

Figure 1
Figure 1. Individual Spectrum plots (n = 10, indicated by different colors).
Although the peak power frequency is within conventional alpha band, there is significant inter-subject variability in alpha power and frequency peaks. Average spectrum denoted by a dashed line.
Figure 2
Figure 2. EEG analysis steps.
1. Gradient and cardioballistic artifact removal performed on raw EEG data; 2. Generation of spectrogram from the entire EEG signal; 3. Generation of EEG spectrum by averaging the spectrogram across the time of the experiment (200 sec); 4a. Selection of five electrodes with the highest alpha peak and selection of subject specific alpha band from the EEG spectrum; 4b. Calculation of instantaneous alpha amplitude throughout the experiment, at the chosen electrodes by means of band pass filtering at the chosen band and Hillbert transform; 5. Calculation of a regressor for fMRI analysis by convolution of the instantaneous alpha amplitude with HRF.
Figure 3
Figure 3. Induced alpha and paradigm related BOLD activation maps.
Different slice views of BOLD activation group maps (n = 10 random effect, p<0.02 uncorrected, min 15 voxels). Top row maps obtained by individual regressors of the induced alpha component. Low row maps obtained directly by the paradigm conditions (i.e. eyes closed Vs eyes open). Note the similarities between the two maps. Areas of main activation are denoted by numbers: L Middle Occipital Cortex (1), L Superior Temporal Sulcus (2), L Middle Temporal Gyrus (3), L Supplementary Motor Area (4), L Hippocampus (5).
Figure 4
Figure 4. Spontaneous and negative alpha BOLD activation maps.
A. Spontaneous alpha BOLD activation maps: Different slice views of BOLD activation group maps (n = 10 random effect, p<0.02 uncorrected, min 15 voxels) obtained by individual regressors of the spontaneous alpha component. Areas of activation are denoted by numbers: Dorso Medial Thalamus (1), Medial Prefrontal Cortex (2), Retrosplenial Cortex (3), Dorso Lateral Prefrontal Cortex (4), Amygdala (5). B. Negative alpha BOLD activation maps: Different slice views of BOLD activation group maps (n = 10 random effect, p<0.02 uncorrected, min 15 voxels) obtained by negative correlation to individual regressors of induced and spontaneous alpha components (red and green respectively). As expected negative correlation in both networks reveal predominantly visual areas. Areas of activation are denoted by numbers: primary Visual Cortex (1), high order visual areas (2).
Figure 5
Figure 5. BOLD time course related to spontaneous and induced alpha networks.
BOLD time course of a single subject was extracted from induced alpha region of interest (ROI) in left STS (top, P<0.0001) and from the spontaneous alpha network in the thalamus (bottom, P<0.0001). The dashed line denotes the measured BOLD time course and the grey line denotes best fit to BOLD oscillations. It is evident that the BOLD time course extracted from the induced alpha network corresponds to the paradigm based alpha modulation while the time course based on spontaneous oscillations corresponds to the on-going alpha modulation.

Similar articles

Cited by

References

    1. Nunez PL, Wingeier BM, Silberstein RB. Spatial-temporal structures of human alpha rhythms: theory, microcurrent sources, multiscale measurements, and global binding of local networks. Hum Brain Mapp. 2001;13:125–164. - PMC - PubMed
    1. Niedermeyer E, Silva FLd. Electroencephalography: Basic Principles, Clinical Applications, and Related Fields. Lippincott Williams & Wilkins; 2005.
    1. Pfurtscheller G, Silva FHLd. Event-related EEG/MEG synchronization and desynchronization: basic principles. Clin Neurophysiol. 1999;110:1842–1857. - PubMed
    1. Adrian ED, Matthews BH. The interpretation of potential waves in the cortex. J Physiol. 1934;81:440–471. - PMC - PubMed
    1. Raichle ME, MacLeod AM, Snyder AZ, Powers WJ, Gusnard DA, et al. A default mode of brain function. Proc Natl Acad Sci U S A. 2001;98:676–682. - PMC - PubMed

Publication types