. 2006 May 15;14(10):4380-94.
doi: 10.1364/OE.14.004380.

High-speed volumetric imaging of cone photoreceptors with adaptive optics spectral-domain optical coherence tomography

Affiliations

High-speed volumetric imaging of cone photoreceptors with adaptive optics spectral-domain optical coherence tomography

Yan Zhang et al. Opt Express. .

Abstract

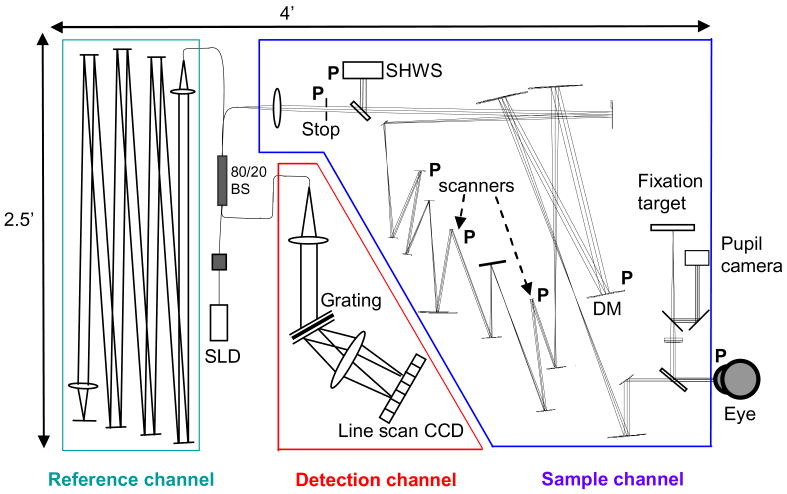
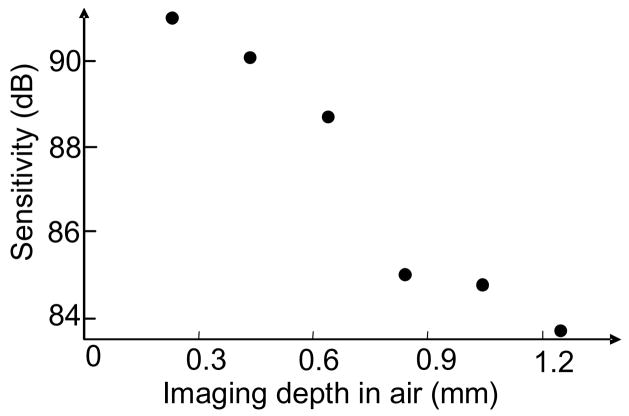
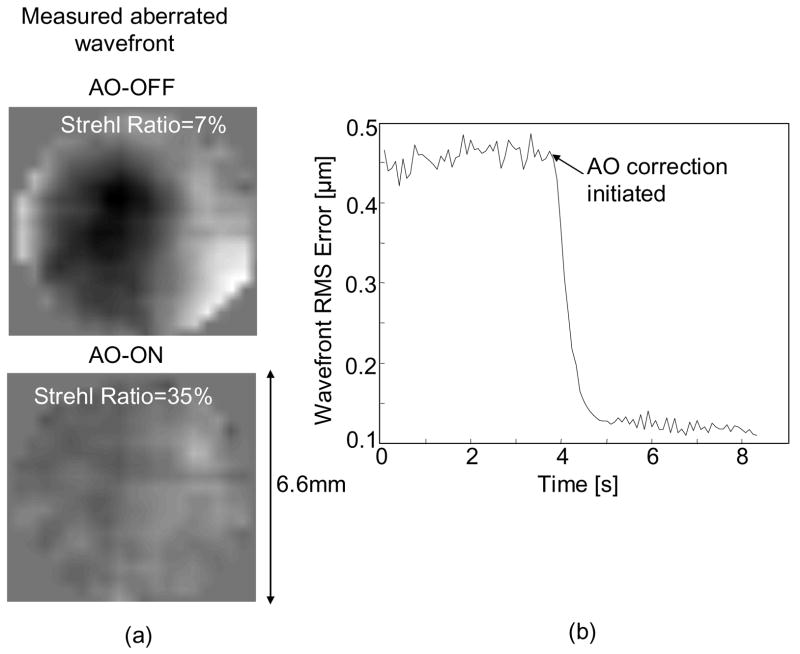
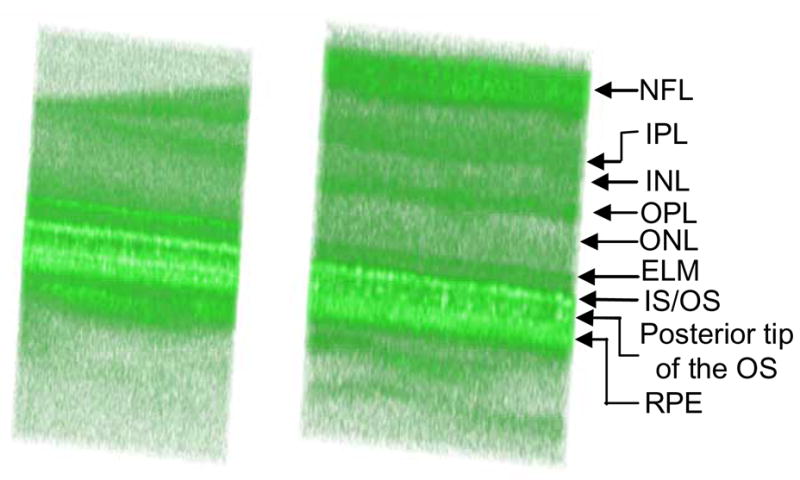
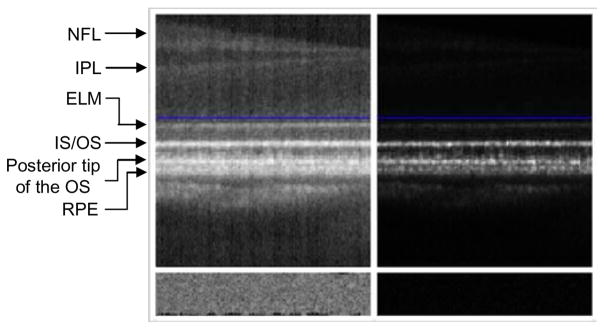
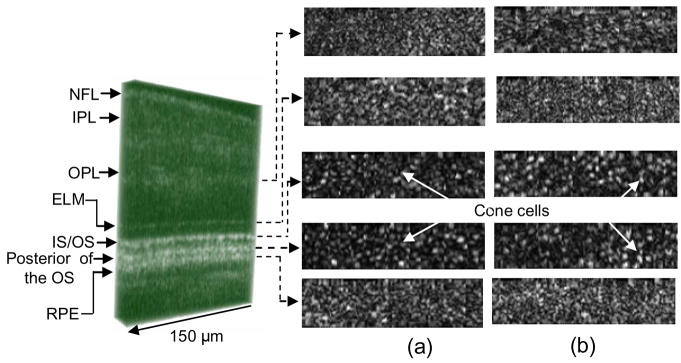
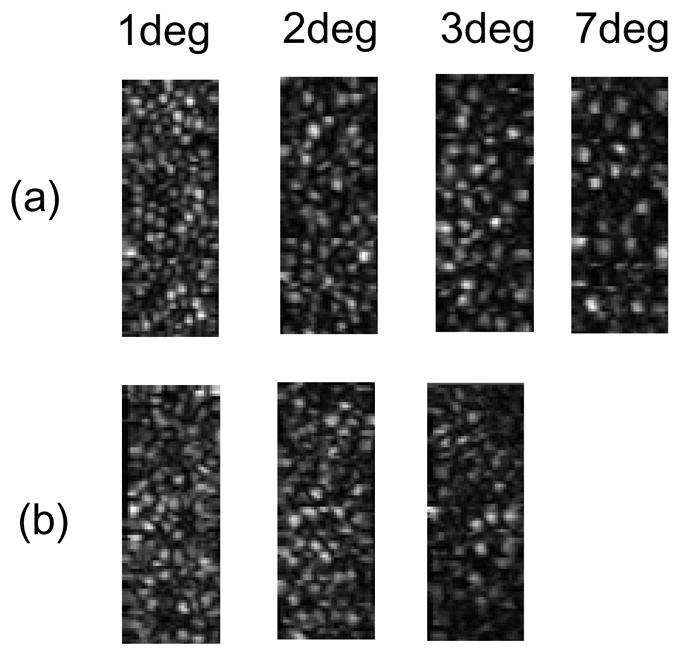
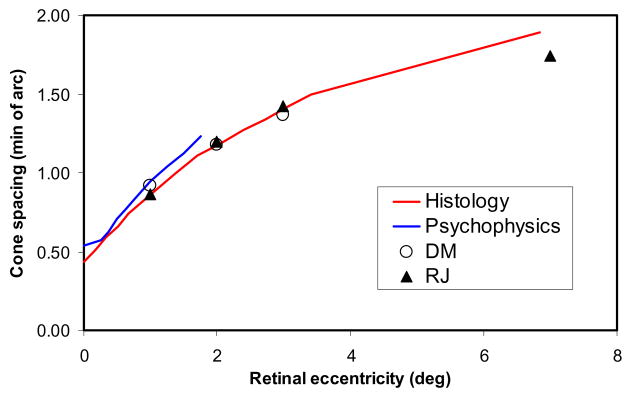
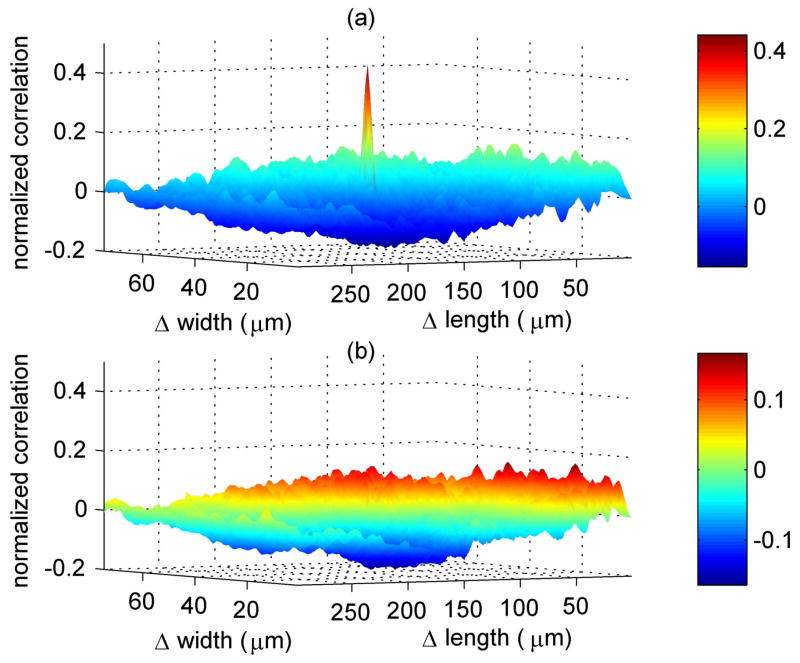
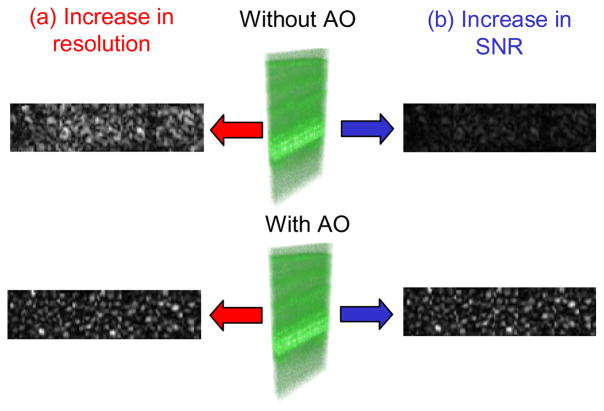
We report the first observations of the three-dimensional morphology of cone photoreceptors in the living human retina. Images were acquired with a high-speed adaptive optics (AO) spectral-domain optical coherence tomography (SD-OCT) camera. The AO system consisted of a Shack-Hartmann wavefront sensor and bimorph mirror (AOptix) that measured and corrected the ocular and system aberrations at a closed-loop rate of 12 Hz. The bimorph mirror was positioned between the XY mechanical scanners and the subject's eye. The SD-OCT system consisted of a superluminescent diode and a 512 pixel line scan charge-coupled device (CCD) that acquired 75,000 A-scans/s. This rate is more than two times faster than that previously reported. Retinal motion artifacts were minimized by quickly acquiring small volume images of the retina with and without AO compensation. Camera sensitivity was sufficient to detect reflections from all major retinal layers. The regular distribution of bright spots observed within C-scans at the inner segment / outer segment (IS/OS) junctions and at the posterior tips of the OS were found to be highly correlated with one another and with the expected cone spacing. No correlation was found between the posterior tips of the OS and the other retinal layers examined, including the retinal pigment epithelium.


Figures

Fig. 1
Fig. 1
Layout of the AO SD-OCT retina camera. The camera consists of three channels: (1) sample channel, (2) reference channel, and (3) detection channel. The AO system is integrated into the sample channel. BS, DM, and P refer to the fiber beam splitter, AOptix deformable mirror, and planes that are conjugate to the pupil of the eye, respectively.
Fig. 2
Fig. 2
Predicted shape of the beam entering the eye for a range of refractive corrections by the wavefront corrector in the (a) original and (b) final AO-OCT designs. Refractive corrections are 0 (middle) and ±3 (left, right) diopters across a 6.6 mm pupil. The two designs are described in the text with the final one shown in Fig. 1.
Fig. 3
Fig. 3
OCT sensitivity as a function of depth in air. A drop in sensitivity of 8 dB/mm was measured.
Fig. 4
Fig. 4
(a) Residual wave aberrations across a 6.6 mm pupil in one subject as measured by the SHWS before and after AO compensation. Wavefront phase is represented by a gray-scale image with black and white tones depicting minimum (−1.0 μm) and maximum (1.19 μm) phase, respectively. (b) An RMS trace of the residual wave aberrations is shown for one subject before and during dynamic AO correction.
Fig. 5
Fig. 5
(2.8 MB) Movie presenting 3D visualization of a small patch of retina at (left) 1° and (right) 7° retinal eccentricity in one subject. Volume images were acquired with AO compensation and focus at the photoreceptor layer. The retinal volume is 38×190×495 μm (width×length×depth). Volume images were acquired within 100 ms and are displayed using an intensity log scale (2.8 MB version).
Fig. 6
Fig. 6
(2.4 Mb) Movie sequence of C-scans extracted from the volume image at 1° eccentricity in Fig. 5. To indicate C-scan depth, a representative B-scan (average of 3 B-scans) with a blue indicator line is also shown. The video is shown twice using (left) log and (right) linear intensity scales in order to facilitate visualization of both bright and dim retinal structures. Focus is approximately at the plane of the photoreceptors. C-scans are 38 μm × 190 μm. (2.4 MB version).
Fig. 7
Fig. 7
C-scans extracted from several depths in AO-OCT volume images that were acquired at 2° eccentricity on (a) subject RJ (b) subject DTM. C-scans correspond to the OPL, ELM, IS/OS junction, posterior of OS, and RPE. Focus is approximately at the plane of the photoreceptors. Images are displayed using a linear intensity scale. C-scans are 38 μm × 150 μm and were acquired in <80 ms.
Fig. 8
Fig. 8
C-scan images at the posterior tips of OS acquired in (a) one subject at 1, 2, 3, 7 degree eccentricity and (b) another subject at 1, 2, 3 degree eccentricity. C-scan images are 38×100 μm subsections of the original images and were acquired in <60 ms. Focus is approximately at the plane of the photoreceptors. Images are displayed using a linear intensity scale.
Fig. 9
Fig. 9
Row spacing of bright spots at the posteriors tips of OS in AO SD-OCT C-scans as a function of retinal eccentricity. Cone row spacing is also shown as estimated from histology (superior and inferior retina) and psychophysical observations of aliasing with interference fringes [17,18].
Fig. 10
Fig. 10
Cross correlation between C-scans at the posterior tip of OS and (a) IS/OS junction and (b) RPE in the same subject. The cross correlation was computed using the Matlab 7.0 (Mathworks, Inc.) function “normxcorr2.”
Fig. 11
Fig. 11
Two primary benefits of correcting ocular aberrations across a large pupil in an OCT retina camera. (a) C-scan images at the posterior tips of the OS show an increase in lateral resolution with AO. The two images are normalized to their own gray scale so as to permit better visualization of the cone photoreceptor structure. (b) The same C-scan images in (a), but adjusted to the same gray scale. Note the increased brightness with AO. Both volume images (with and without AO) were acquired at essentially the same 2° retinal eccentricity. Focus is approximately at the plane of the photoreceptors. C-scans are displayed using a linear intensity scale; volume images are displayed using a log scale.

Similar articles

Cited by

References

    1. Huang D, Swanson EA, Lin CP, Schuman JS, Stinson WG, Chang W, Hee MR, Flotte T, Gregory K, Puliafito C, Fujimoto JG. Optical coherence tomography. Science. 1991;254:1178–81. - PMC - PubMed
    1. Fercher AF, Hitzenberger CK, Kamp G, Elzaiat Y. Measurement of intraocular distance by backscattering spectral interferometry. Opt Commun. 1995;117:43–48.
    1. Wojtkowski M, Leitgeb RA, Kowalczyk A, Bajraszewski T, Fercher AF. In vivo human retinal imaging by Fourier domain optical coherence tomography. J Biomed Opt. 2002;7:457–463. - PubMed
    1. Cense B, Nassif NA, Chen TC, Pierce MC, Yun S, Park BH, Bouma BE, Tearney GJ, de Boer JF. Ultrahigh-resolution high-speed retinal imaging using spectral-domain optical coherence tomography. Opt Express. 2004;12:2435–2447. - PubMed
    1. Wojtkowski M, Srinivasan VJ, Ko TH, Fujimoto JG, Kowalczyk A, Duker JS. Ultrahigh-resolution, high-speed, Fourier domain optical coherence tomography and methods for dispersion compensation. Opt Express. 2004;12:2404–2421. - PubMed