

White-matter lesions along the cholinergic tracts are related to cortical sources of EEG rhythms in amnesic mild cognitive impairment
- PMID: 19097164
- PMCID: PMC6871072
- DOI: 10.1002/hbm.20612
White-matter lesions along the cholinergic tracts are related to cortical sources of EEG rhythms in amnesic mild cognitive impairment
Abstract
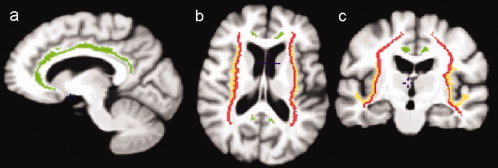
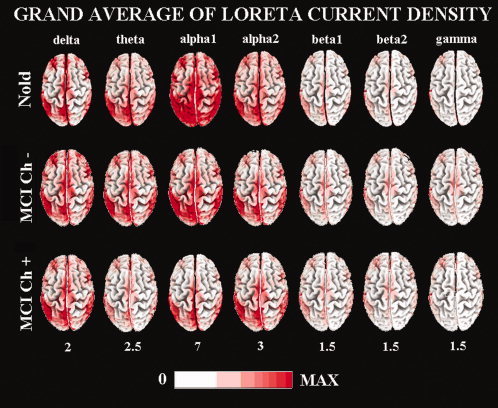
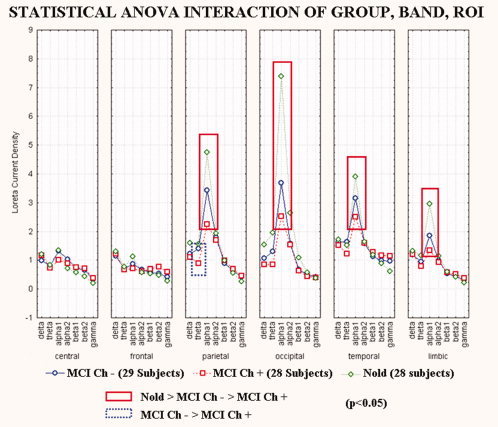
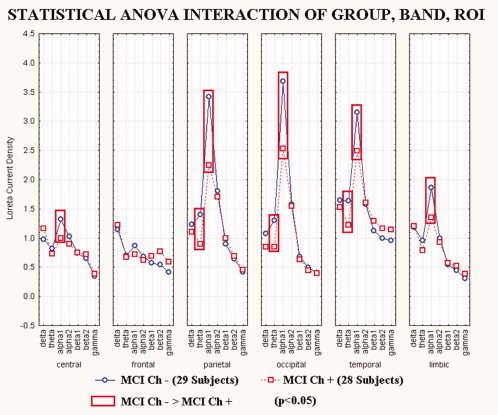
Does impairment of cholinergic systems represent an important factor in the development of amnesic mild cognitive impairment (aMCI), as a preclinical stage of Alzheimer's disease (AD)? Here we tested the hypothesis that electroencephalographic (EEG) rhythms, known to be modulated by the cholinergic system, may be particularly affected in aMCI patients with lesions along the cholinergic white-matter tracts. Eyes-closed resting EEG data were recorded in 28 healthy elderly (Nold) and 57 aMCI patients. Lesions along the cholinergic white-matter tracts were detected with fluid-attenuated inversion recovery sequences on magnetic resonance imaging. The estimation of the cholinergic lesion was performed with a validated semi-automatic algorithm pipeline after registration to a stereotactic template, image integration with stereotactic masks of the cholinergic tracts, and normalization to intracranial volume. The aMCI patients were divided into two groups of high (MCI Ch+; N = 29; MMSE = 26.2) and low cholinergic damage (MCI Ch-; N = 28; MMSE = 26.6). EEG rhythms of interest were delta (2-4 Hz), theta (4-8 Hz), alpha 1 (8-10.5 Hz), alpha 2 (10.5-13 Hz), beta 1 (13-20 Hz), and beta 2 (20-30 Hz). Cortical EEG generators were estimated by LORETA software. As main results, (i) power of occipital, parietal, temporal, and limbic alpha 1 sources was maximum in Nold, intermediate in MCI Ch-, and low in MCI Ch+ patients; (ii) the same trend was true in theta sources. These results are consistent with the hypothesis that damage to the cholinergic system is associated with alterations of EEG sources in aMCI subjects.
(c) 2008 Wiley-Liss, Inc.
Figures
Similar articles
-
Global functional coupling of resting EEG rhythms is related to white-matter lesions along the cholinergic tracts in subjects with amnesic mild cognitive impairment.J Alzheimers Dis. 2010;19(3):859-71. doi: 10.3233/JAD-2010-1290. J Alzheimers Dis. 2010. PMID: 20157242
-
Resting state cortical electroencephalographic rhythms and white matter vascular lesions in subjects with Alzheimer's disease: an Italian multicenter study.J Alzheimers Dis. 2011;26(2):331-46. doi: 10.3233/JAD-2011-101710. J Alzheimers Dis. 2011. PMID: 21673406
-
White-matter vascular lesions correlate with alpha EEG sources in mild cognitive impairment.Neuropsychologia. 2008;46(6):1707-20. doi: 10.1016/j.neuropsychologia.2008.03.021. Epub 2008 Apr 8. Neuropsychologia. 2008. PMID: 18440574
-
Hippocampal volume and cortical sources of EEG alpha rhythms in mild cognitive impairment and Alzheimer disease.Neuroimage. 2009 Jan 1;44(1):123-35. doi: 10.1016/j.neuroimage.2008.08.005. Epub 2008 Aug 16. Neuroimage. 2009. PMID: 18805495
-
Reactivity of cortical alpha rhythms to eye opening in mild cognitive impairment and Alzheimer's disease: an EEG study.J Alzheimers Dis. 2010;22(4):1047-64. doi: 10.3233/JAD-2010-100798. J Alzheimers Dis. 2010. PMID: 20930306
Cited by
-
Cognitive Correlates of Basal Forebrain Atrophy and Associated Cortical Hypometabolism in Mild Cognitive Impairment.Cereb Cortex. 2016 Jun;26(6):2411-2426. doi: 10.1093/cercor/bhv062. Epub 2015 Apr 2. Cereb Cortex. 2016. PMID: 25840425 Free PMC article.
-
Cognitive impairment and EEG background activity in adults with Down's syndrome: a topographic study.Hum Brain Mapp. 2011 May;32(5):716-29. doi: 10.1002/hbm.21061. Hum Brain Mapp. 2011. PMID: 21484947 Free PMC article.
-
The EEG as an index of neuromodulator balance in memory and mental illness.Front Neurosci. 2014 Apr 8;8:63. doi: 10.3389/fnins.2014.00063. eCollection 2014. Front Neurosci. 2014. PMID: 24782698 Free PMC article.
-
Electroencephalography, Magnetoencephalography, and Cognitive Reserve: A Systematic Review.Arch Clin Neuropsychol. 2021 Oct 13;36(7):1374-1391. doi: 10.1093/arclin/acaa132. Arch Clin Neuropsychol. 2021. PMID: 33522563 Free PMC article.
-
Gender-Specific Hippocampal Dysrhythmia and Aberrant Hippocampal and Cortical Excitability in the APPswePS1dE9 Model of Alzheimer's Disease.Neural Plast. 2016;2016:7167358. doi: 10.1155/2016/7167358. Epub 2016 Oct 20. Neural Plast. 2016. PMID: 27840743 Free PMC article.
References
-
- Albert M,Smith LA,Scherr PA,Taylor JO,Evans DA,Funkenstein HH ( 1991): Use of brief cognitive tests to identify individuals in the community with clinically diagnosed Alzheimer's disease. Int J Neurosci 57: 167–178. - PubMed
-
- Anderer P,Saletu B,Pascual‐Marqui RD ( 2000): Effect of the 5‐HT(1A) partial agonist buspirone on regional brain electrical activity in man: a functional neuroimaging study using low‐resolution electromagnetic tomography (LORETA). Psychiatry Res 100: 81–96. - PubMed
-
- Anderer P,Saletu B,Semlitsch HV,Pascual‐Marqui RD ( 2003): Non‐invasive localization of P300 sources in normal aging and age‐associated memory impairment. Neurobiol Aging 24: 463–479. - PubMed
-
- Anderer P,Saletu B,Saletu‐Zyhlarz G,Gruber D,Metka M,Huber J,Pascual‐Marqui RD ( 2004): Brain regions activated during an auditory discrimination task in insomniac postmenopausal patients before and after hormone replacement therapy: Low‐resolution brain electromagnetic tomography applied to event‐related potentials. Neuropsychobiology 49: 134–153. - PubMed
-
- Andersen P,Morris R,Amaral D,Bliss T,O'Keefe J ( 2007): The Hippocampus Book. New York: Oxford University Press.
Publication types
MeSH terms
Substances
LinkOut - more resources
Full Text Sources
Research Materials
