. 2009 Jan;238(1):29-42.
doi: 10.1002/dvdy.21810.

Transcriptional dynamics of endodermal organ formation

Affiliations

Transcriptional dynamics of endodermal organ formation

Richard I Sherwood et al. Dev Dyn. 2009 Jan.

Abstract

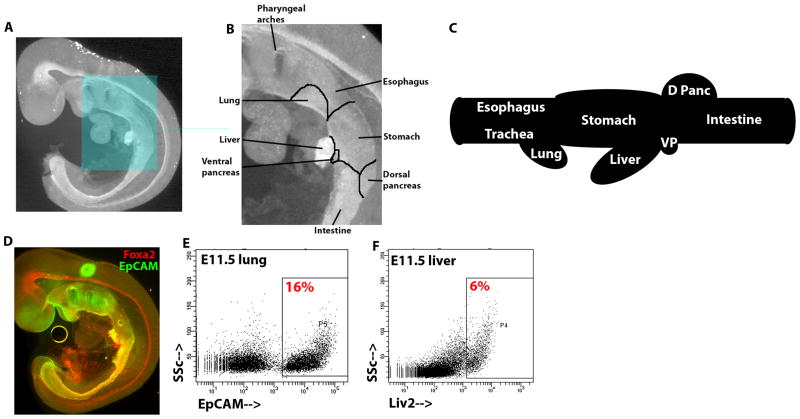
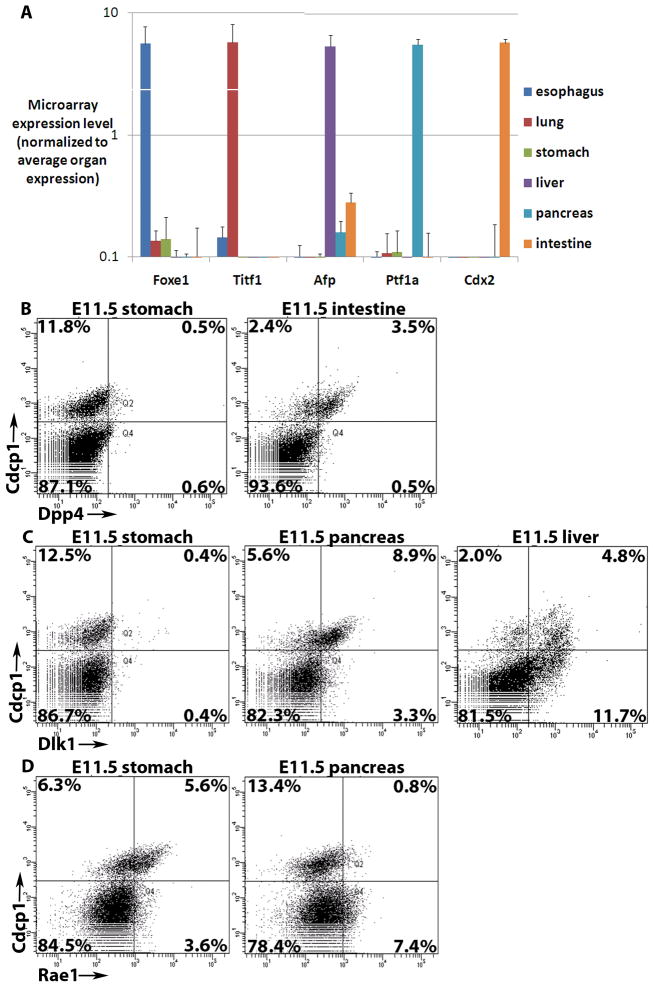
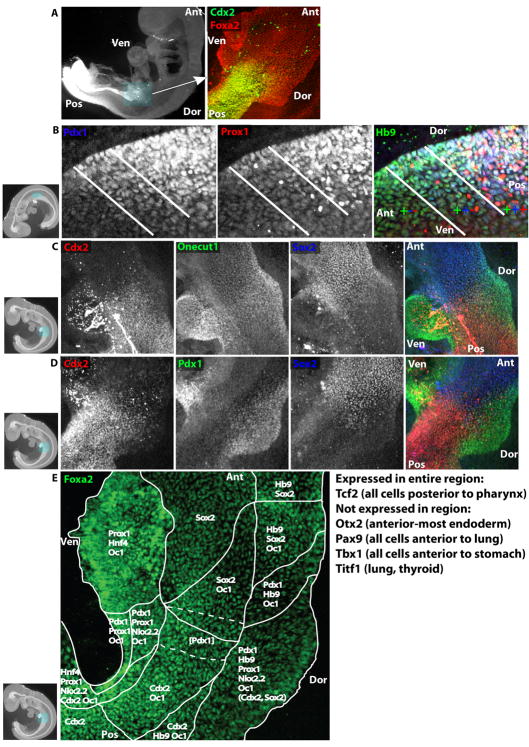
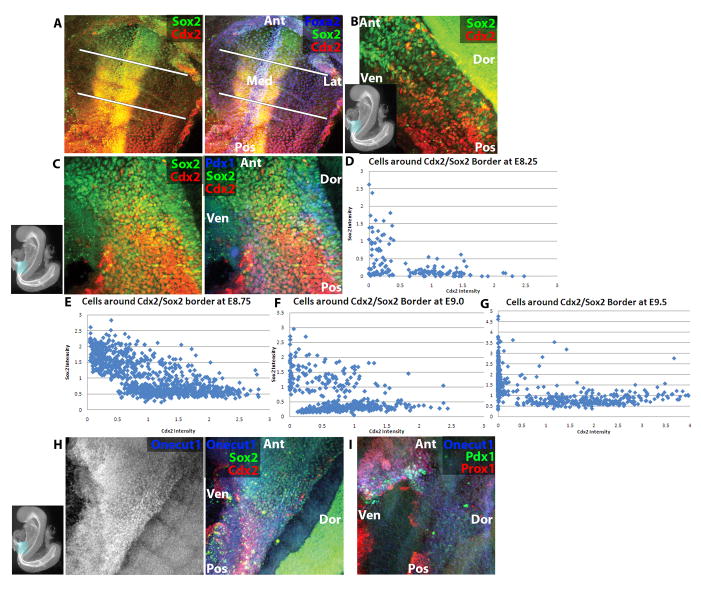
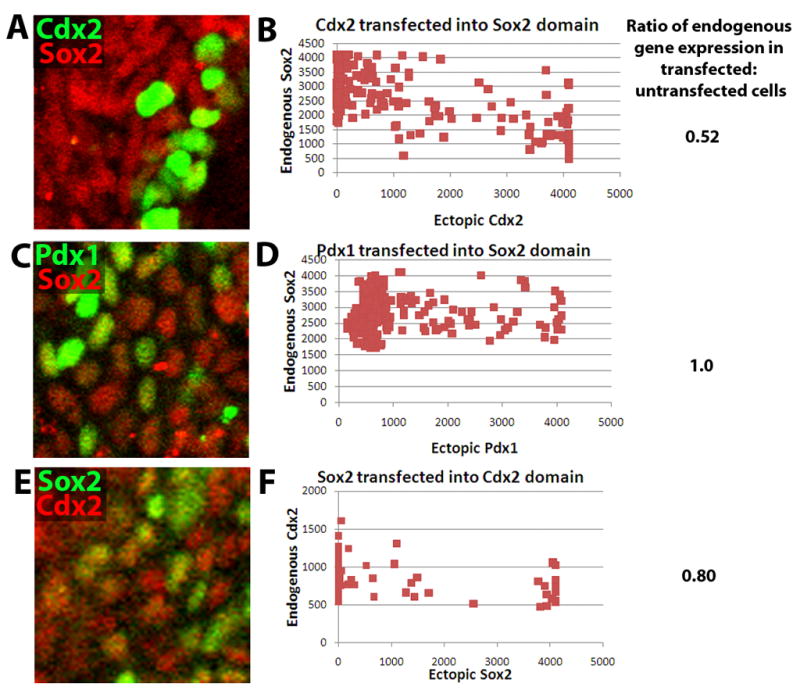
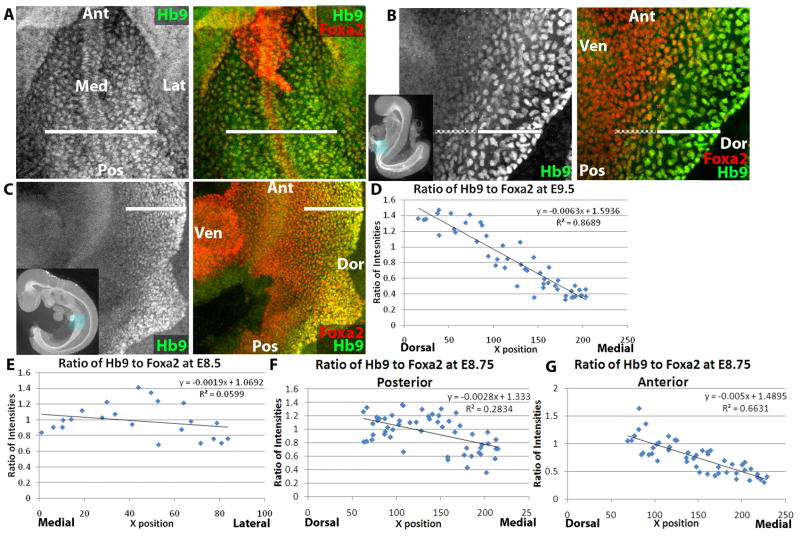
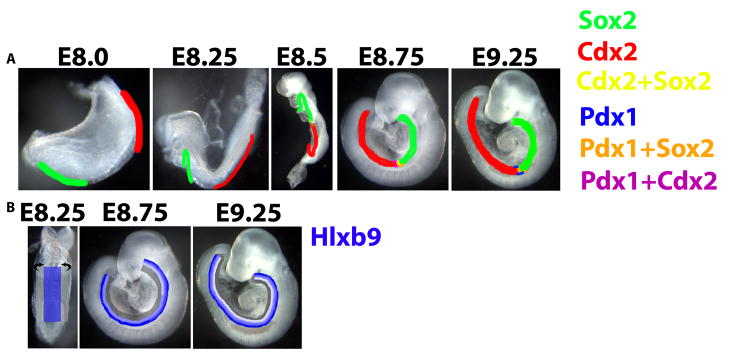
Although endodermal organs including the liver, pancreas, and intestine are of significant therapeutic interest, the mechanism by which the endoderm is divided into organ domains during embryogenesis is not well understood. To better understand this process, global gene expression profiling was performed on early endodermal organ domains. This global analysis was followed up by dynamic immunofluorescence analysis of key transcription factors, uncovering novel expression patterns as well as cell surface proteins that allow prospective isolation of specific endodermal organ domains. Additionally, a repressive interaction between Cdx2 and Sox2 was found to occur at the prospective stomach-intestine border, with the hepatic and pancreatic domains forming at this boundary, and Hlxb9 was revealed to have graded expression along the dorsal-ventral axis. These results contribute to understanding the mechanism of endodermal organogenesis and should assist efforts to replicate this process using pluripotent stem cells.


Figures

Figure 1
Figure 1
Diagrams and isolation strategy of endodermal organ domains. (A) E9.5 embryo wholemount immunofluorescence image of Foxa2 antibody staining. Boxed region is magnified in (B), and the nascent organ domains within the continuous endodermal epithelium are demarcated and labeled. (C) Schematic of the gut tube at E11.5 with the distinct organ domains labeled. (D) E9.5 embryo wholemount immunofluorescence image of Foxa2 (red) and EpCAM (green). (E and F) Flow cytometric analysis of live, dissected (E) E11.5 lung stained with EpCAM (X-axis) and (F) E11.5 liver stained with Liv2 (X-axis), plotted against side scatter (Y-axis). The percentage of cells within the boxed region is displayed.
Figure 2
Figure 2
Results of microarray analysis of endodermal organs. (A) Graph of microarray expression values of five genes reported to be specific to endodermal organ domains. Arbitrary expression values are normalized to the average expression among the six organ domains profiled and are displayed on a log scale with standard deviation of three replicates. (B–D) Flow cytometric analysis of live, dissected (B) E11.5 stomach (left) and intestine (right) stained with Dpp4 (X-axis), (C) E11.5 stomach (left), pancreas (middle) and liver (right) stained with Dlk1 (X-axis), and (D) E11.5 stomach (left) and pancreas (right) stained with Rae1 (X-axis), all plotted against pan-endodermal Cdcp1 (Y-axis). The percentage of cells within each quadrant is displayed.
Figure 3
Figure 3
A high-resolution transcriptional map of the E9.5 stomach-intestine border. (A) E9.5 embryo wholemount immunofluorescence image of Cdx2 antibody staining (left). Boxed region is magnified in right panel, a wholemount confocal immufluorescence image of the stomach-intestine border co-stained with Cdx2 (green) and Foxa2 (red). (B–E) E9.5 embryo wholemount confocal immunofluorescence images. (B) Dorsal pancreatic region co-stained with Pdx1 (left and blue in merged image on right), Prox1 (middle, red), and Hlxb9 (abbreviated as Hb9, green). White lines demarcate regions of single expression of Hlxb9, co-expression of Hlxb9 and Pdx1, and co-expression of Hlxb9, Pdx1 and Prox1. (C) Stomach-intestine border co-stained with Cdx2 (left, red), Onecut1 (middle, green), and Sox2 (right, blue) and merged image (far right). (D) Stomach-intestine border co-stained with Cdx2 (left, red), Pdx1 (middle, green), and Sox2 (right, blue) and merged image (far right). (E) Stomach-intestine border stained with Foxa2. White lines demarcate regions of expression of transcription factors listed in each region. Dotted white lines demarcate a sub-region where, in addition to all other factors listed in the two solid-line regions, Pdx1 (in parentheses) is expressed weakly and is intermixed with Pdx1 cells. In the dorsal Pdx1-expressing region, Sox2 and Cdx2 (in parentheses) are expressed atE8.75, but they recede anteriorly and posteriorly respectively and become entirely excluded by E9.5. In thumbnail images, boxes highlight displayed region, and axes of embryo are labeled. Ant=Anterior, Pos=Posterior, Dor=Dorsal, Ven=Ventral.
Figure 4
Figure 4
Anterior-posterior transcriptional dynamics at the stomach-intestine border. (A) E8.25 (4–6-somite stage) embryo wholemount confocal immunofluorescence image of Sox2 (green), Cdx2 (red) and Foxa2 (blue, right only). White lines demarcate region of endoderm expressing neither Cdx2 nor Sox2. (B) E8.5 (9–11-somite stage) embryo wholemount confocal immunofluorescence image of Sox2 (green) and Cdx2 (red). (C) E8.75 (13–15-somite stage) embryo wholemount confocal immunofluorescence image of Sox2 (green), Cdx2 (red) and Pdx1 (blue, right only). (D–G) Graphs plotting mean nuclear intensity ratio of Cdx2 (X-axis) to Sox2 (Y-axis) in populations of cells spanning the stomach-intestine border at E8.25 6–8-somite stage (D), E8.75 (E), E9.0 (F), and E9.5 (G). Each dot represents one nucleus, and intensity values of Cdx2 and Sox2 are normalized as ratios to Foxa2 expression. (H) E8.5 (6–8-somite stage) embryo wholemount confocal immunofluorescence image of Sox2 (green, right only), Cdx2 (red, right only) and Onecut1 (blue). (I) E8.75 (11–13-somite stage) embryo wholemount confocal immunofluorescence image of Pdx1 (green), Prox1 (red) and Onecut1 (blue). In thumbnail images, boxes highlight displayed region, and axes of embryo are labeled. Ant=Anterior, Pos=Posterior, Med=Medial, Lat=Lateral, Dor=Dorsal, Ven=Ventral.
Figure 5
Figure 5
Dominance of Cdx2 over Sox2 in anterior-posterior patterning. (A, C, E) Wholemount confocal immunofluorescence of E8.25 embryos electroporated with (A) pCAGGS Cdx2 IRES GFP, (B) pCAGGS Pdx1 IRES GFP, or (C) pCAGGS Sox2 IRES GFP and cultured for 24 hours in 1:1 DMEM-F12:rat serum. In (A), Cdx2 is in green and Sox2 in red, in (B), Pdx1 is in green and Sox2 in red, and in (C), Sox2 is in green and Cdx2 in red. The endogenous gene is typically expressed in all nuclei within the imaged territory, so green nuclei are indicative of ectopic gene downregulation of the endogenous gene, whereas yellow nuclei are indicative of lack of downregulation. (B, D, F) Graphs plotting mean nuclear intensity ratio of the transfected factor (X-axis) to the endogenous gene (Y-axis). The average ratio of endogenous gene expression in transfected vs. untransfected cells is displayed to the right of each graph.
Figure 6
Figure 6
Hlxb9 forms a dorsal-ventral gradient within the endoderm. (A) E8.25 (4–6-somite stage) embryo wholemount confocal immunofluorescence image of Hlxb9 (abbreviated as Hb9, green) and Foxa2 (red, right only). White line demarcates region of endoderm expressing Hlxb9. (B) E8.5 (9–11-somite stage) embryo wholemount confocal immunofluorescence image of Hlxb9 (green) and Foxa2 (red, right only). Solid white line demarcates region of endoderm expressing Hlxb9 strongly and dashed white line demarcates region expressing Hlxb9 weakly. (C) E9.5 embryo wholemount confocal immunofluorescence image of Hlxb9 (green) and Foxa2 (red, right only). White line demarcates region of endoderm expressing Hlxb9, although levels of Hlxb9 expression decrease from dorsal to ventral. (D–G) Graphs plotting ratio of mean nuclear intensity of Hlxb9 to Foxa2 (Y-axis) in endodermal cells at E9.5 (D), E8.5 (E), and E8.75 (F–G). Cells are plotted by their position along the dorsal-ventral axis (X-axis) from dorsal to medial (D, F, G) or medial to lateral (E). Equation and R2 value are shown for each graph. In panels F–G, graphs are of posterior (F) and anterior (G) regions of the same embryo. In thumbnail images, boxes highlight displayed region, and axes of embryo are labeled. Ant=Anterior, Pos=Posterior, Med=Medial, Lat=Lateral, Dor=Dorsal, Ven=Ventral.
Figure 7
Figure 7
Schematization of anterior-posterior and dorsal-ventral transcriptional dynamics in the endoderm. (A) Endodermal Sox2 (green) and Cdx2 (red) expression start at the anterior and posterior ends of the endoderm, respectively. Between E8.0–E8.5, the domains of these transcription factors expand toward each other, most likely as a result of endodermal cells that do not express either factor initiating expression of Sox2 or Cdx2. At E8.5 (~11–13-somite stage), the Sox2 and Cdx2 expression domains meet, and between E8.75–E9.25, these domains overlap slightly, although by E9.25, co-expression becomes rare. Pdx1 expression begins on the ventral and slightly later the dorsal side of the endoderm at E8.5 at the border of the Cdx2 and Sox2 domains, and the initial Pdx1-expressing cells co-express either Sox2 or Cdx2. By E9.25, dorsal and ventral Pdx1-expressing cells lose expression of Sox2 and Cdx2, although weaker Pdx1 expression is still detected in Sox2-expressing cells immediately anterior to the border of Sox2 and Cdx2. (B) Endodermal Hlxb9 expression (blue) is present at E8.25 at uniform levels in the medial half of the endoderm. Through tubulogenesis, the medial endoderm stays dorsal while the Hlxb9 lateral endoderm wraps ventrally. By E8.75, the most dorsal quarter of the endoderm expresses Hlxb9 strongly, while the next quarter of the dorsal endoderm expresses Hlxb9 more weakly. A gradient of Hlxb9 expression emerges first in the anterior endoderm, which undergoes tubulogenesis earliest, and progressively more posteriorly, such that by E9.25, Hlxb9 is expressed in a gradient in the dorsal half of the endoderm throughout the anterior-posterior axis of the endoderm.

References

    1. Ang SL, Wierda A, Wong D, Stevens KA, Cascio S, Rossant J, Zaret KS. The formation and maintenance of the definitive endoderm lineage in the mouse: involvement of HNF3/forkhead proteins. Development. 1993;119:1301–1315. - PubMed
    1. Beck F, Erler T, Russell A, James R. Expression of Cdx-2 in the mouse embryo and placenta: possible role in patterning of the extra-embryonic membranes. Dev Dyn. 1995;204:219–227. - PubMed
    1. Beck F, Tata F, Chawengsaksophak K. Homeobox genes and gut development. Bioessays. 2000;22:431–441. - PubMed
    1. Burke Z, Oliver G. Prox1 is an early specific marker for the developing liver and pancreas in the mammalian foregut endoderm. Mech Dev. 2002;118:147–155. - PubMed
    1. Burlison JS, Long Q, Fujitani Y, Wright CV, Magnuson MA. Pdx-1 and Ptf1a concurrently determine fate specification of pancreatic multipotent progenitor cells. Dev Biol. 2008;316:74–86. - PMC - PubMed

Publication types

MeSH terms