

Rigid-body motion correction with self-navigation MRI
- PMID: 19097240
- PMCID: PMC5444455
- DOI: 10.1002/mrm.21883
Rigid-body motion correction with self-navigation MRI
Abstract
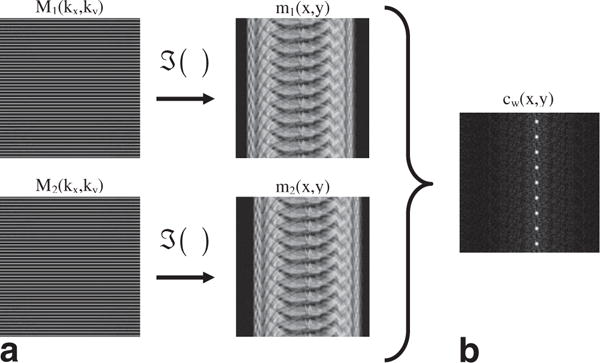
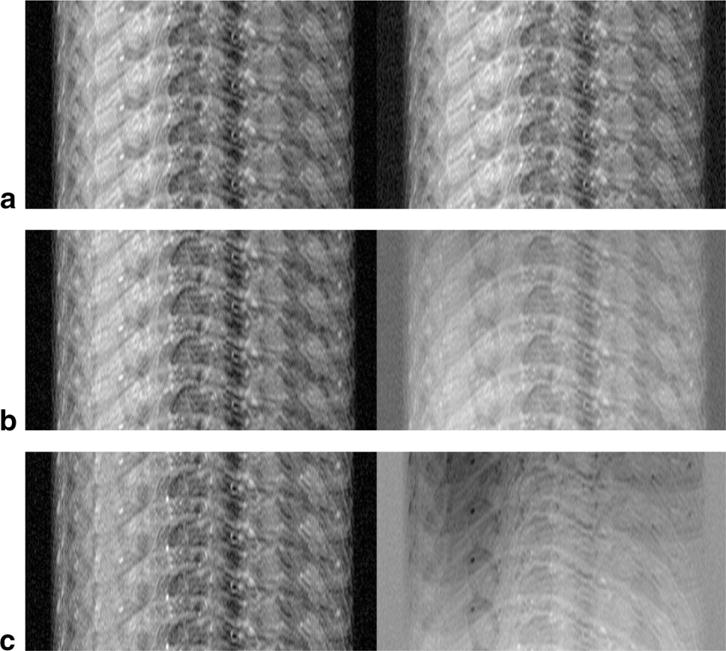
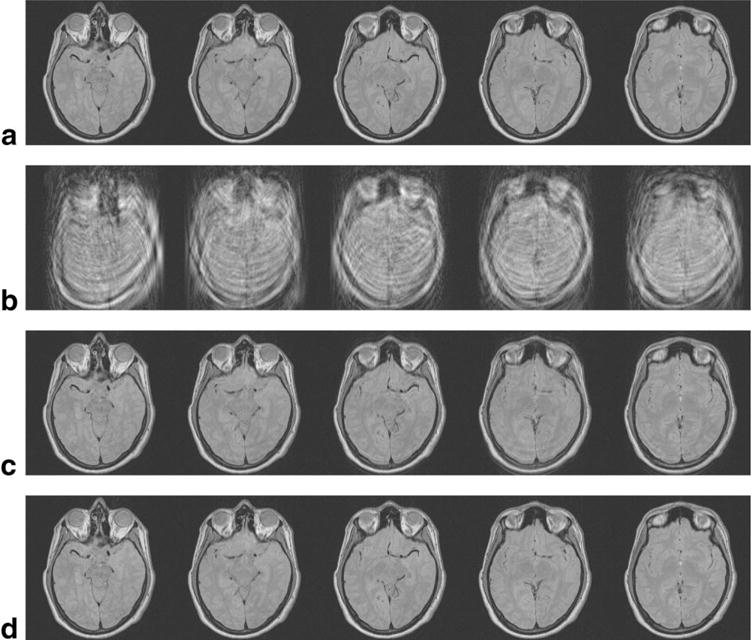
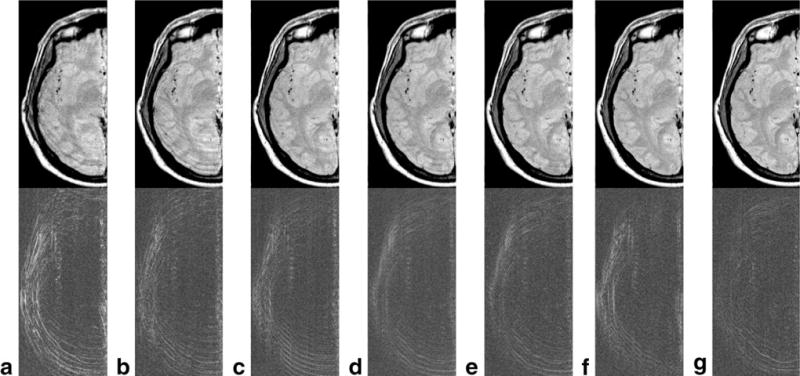
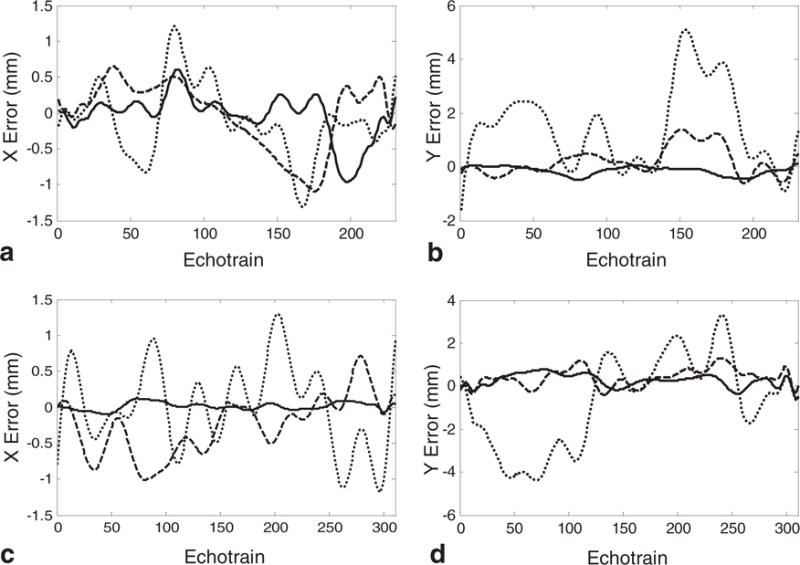
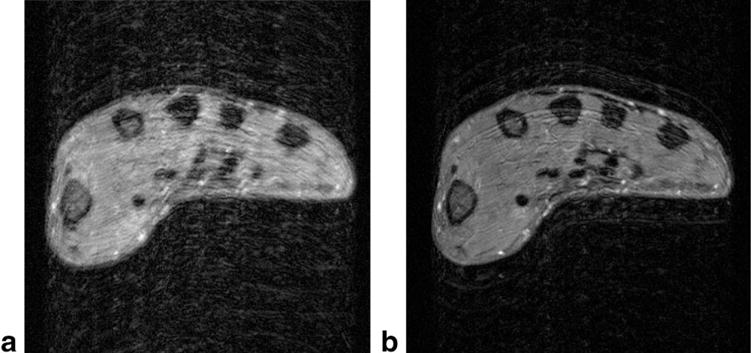
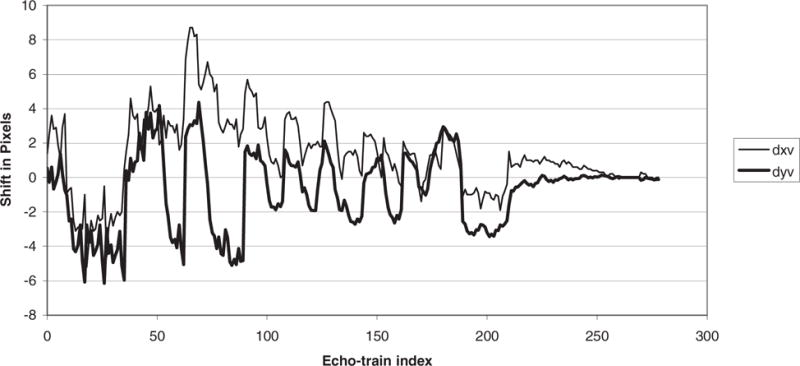
The use of phase correlation to detect rigid-body translational motion is reviewed and applied to individual echotrains in turbo-spin-echo data acquisition. It is shown that when the same echotrain is acquired twice, the subsampled correlation provides an array of delta-functions, from which the motion that occurred between the acquisitions of the two echotrains can be measured. It is shown further that a similar correlation can be found between two sets of equally spaced measurements that are adjacent in k-space. By measuring the motion between all adjacent pairs of k-space subgroups, the complete motion history of a subject can be determined and the motion artifacts in the image can be corrected. Some of the limiting factors in using this technique are investigated with turbo-spin-echo head and hand images.
Figures


Similar articles
-
Retrospective Rigid Motion Correction in k-Space for Segmented Radial MRI.IEEE Trans Med Imaging. 2014 Jan;33(1):1-10. doi: 10.1109/TMI.2013.2268898. Epub 2013 Jun 14. IEEE Trans Med Imaging. 2014. PMID: 23782798
-
Intrinsic detection of motion in segmented sequences.Magn Reson Med. 2011 Apr;65(4):1084-9. doi: 10.1002/mrm.22681. Epub 2010 Nov 3. Magn Reson Med. 2011. PMID: 21413072 Free PMC article.
-
Diffusion tensor imaging (DTI) with retrospective motion correction for large-scale pediatric imaging.J Magn Reson Imaging. 2012 Oct;36(4):961-71. doi: 10.1002/jmri.23710. Epub 2012 Jun 11. J Magn Reson Imaging. 2012. PMID: 22689498 Free PMC article.
-
Prospective head motion correction using FID-guided on-demand image navigators.Magn Reson Med. 2017 Jul;78(1):193-203. doi: 10.1002/mrm.26364. Epub 2016 Aug 16. Magn Reson Med. 2017. PMID: 27529516
-
Prospective motion correction in brain imaging: a review.Magn Reson Med. 2013 Mar 1;69(3):621-36. doi: 10.1002/mrm.24314. Epub 2012 May 8. Magn Reson Med. 2013. PMID: 22570274 Review.
Cited by
-
Motion correction in MRI of the brain.Phys Med Biol. 2016 Mar 7;61(5):R32-56. doi: 10.1088/0031-9155/61/5/R32. Epub 2016 Feb 11. Phys Med Biol. 2016. PMID: 26864183 Free PMC article. Review.
-
Towards retrospective motion correction and reconstruction for clinical 3D brain MRI protocols with a reference contrast.MAGMA. 2024 Oct;37(5):807-823. doi: 10.1007/s10334-024-01161-y. Epub 2024 May 17. MAGMA. 2024. PMID: 38758490 Free PMC article.
-
Model predictive filtering for improved temporal resolution in MRI temperature imaging.Magn Reson Med. 2010 May;63(5):1269-79. doi: 10.1002/mrm.22321. Magn Reson Med. 2010. PMID: 20432298 Free PMC article.
-
Improved respiratory self-navigation for 3D radial acquisitions through the use of a pencil-beam 2D-T2 -prep for free-breathing, whole-heart coronary MRA.Magn Reson Med. 2018 Mar;79(3):1293-1303. doi: 10.1002/mrm.26764. Epub 2017 May 31. Magn Reson Med. 2018. PMID: 28568961 Free PMC article.
-
On the significance of motion degradation in high-resolution 3D μMRI of trabecular bone.Acad Radiol. 2011 Oct;18(10):1205-16. doi: 10.1016/j.acra.2011.06.006. Epub 2011 Aug 4. Acad Radiol. 2011. PMID: 21816638 Free PMC article.
References
-
- Hennig J, Nauerth A, Friedburg H. RARE imaging: a fast imaging method for clinical MR. Magn Reson Med. 1986;3:823–833. - PubMed
-
- Mulkern RV, Wong ST, Winalski C, Jolesz FA. Contrast manipulation and artifact assessment of 2D and 3D RARE sequences. Magn Reson Imaging. 1990;8:557–566. - PubMed
-
- Constable RT, Anderson AW, Zhong J, Gore JC. Factors influencing contrast in fast spin-echo MR imaging. Magn Reson Imaging. 1992;10:497–511. - PubMed
-
- Constable RT, Gore JC. The loss of small objects in variable TE imaging: implications for FSE, RARE, and EPI. Magn Reson Med. 1992;28:9–24. - PubMed
-
- Le Roux P, Hinks RS. Stabilization of echo amplitudes in FSE sequences. Magn Reson Med. 1993;30:183–190. - PubMed
Publication types
MeSH terms
Grants and funding
LinkOut - more resources
Full Text Sources
Other Literature Sources
Medical
