. 2009 Feb;149(2):1087-98.
doi: 10.1104/pp.108.129288. Epub 2008 Dec 19.

Regulation of respiration and fermentation to control the plant internal oxygen concentration

Affiliations

Regulation of respiration and fermentation to control the plant internal oxygen concentration

Ana Zabalza et al. Plant Physiol. 2009 Feb.

Abstract

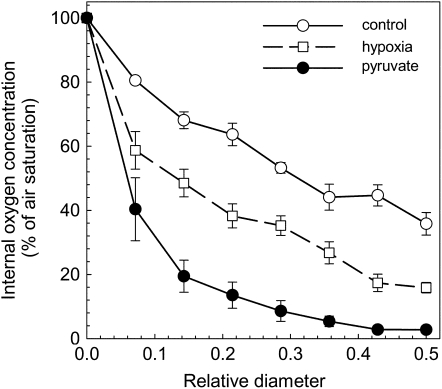
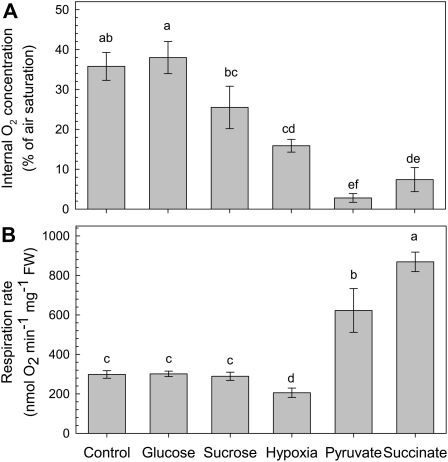
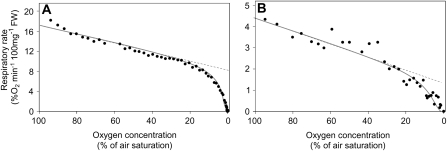
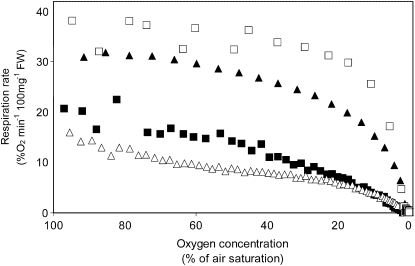
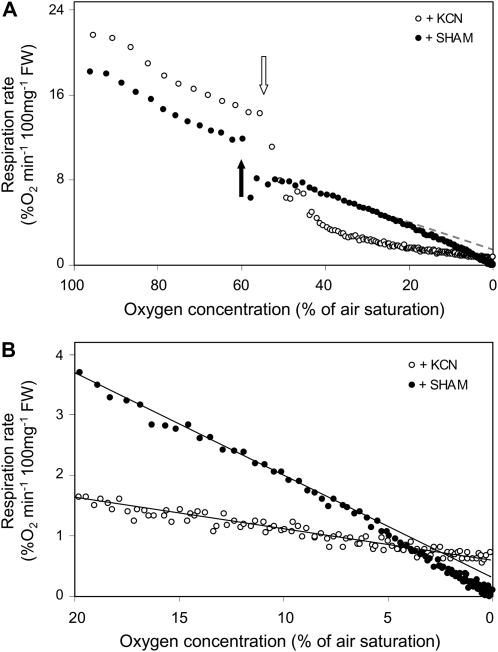
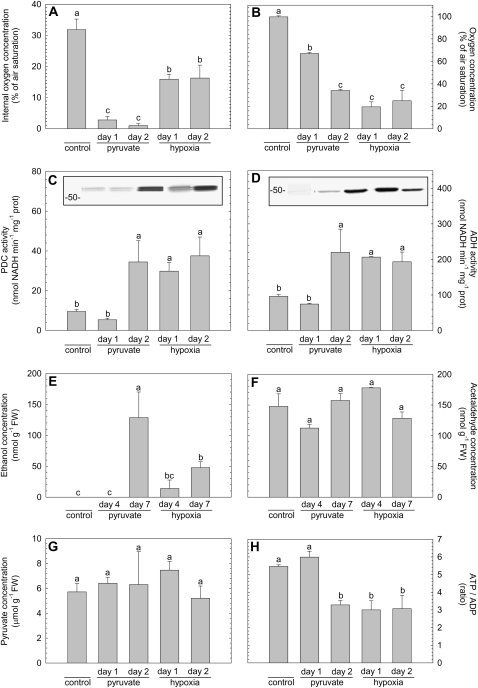
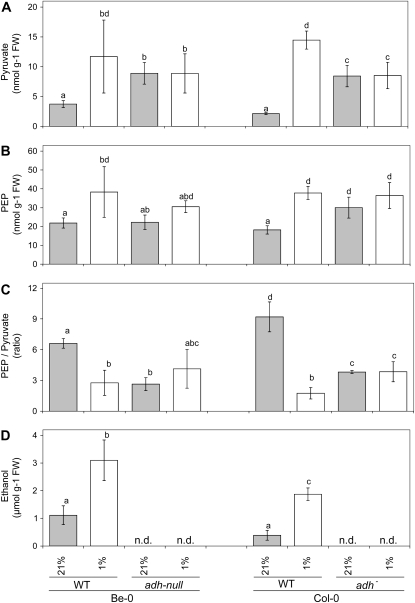
Plant internal oxygen concentrations can drop well below ambient even when the plant grows under optimal conditions. Using pea (Pisum sativum) roots, we show how amenable respiration adapts to hypoxia to save oxygen when the oxygen availability decreases. The data cannot simply be explained by oxygen being limiting as substrate but indicate the existence of a regulatory mechanism, because the oxygen concentration at which the adaptive response is initiated is independent of the actual respiratory rate. Two phases can be discerned during the adaptive reaction: an initial linear decline of respiration is followed by a nonlinear inhibition in which the respiratory rate decreased progressively faster upon decreasing oxygen availability. In contrast to the cytochrome c pathway, the inhibition of the alternative oxidase pathway shows only the linear component of the adaptive response. Feeding pyruvate to the roots led to an increase of the oxygen consumption rate, which ultimately led to anoxia. The importance of balancing the in vivo pyruvate availability in the tissue was further investigated. Using various alcohol dehydrogenase knockout lines of Arabidopsis (Arabidopsis thaliana), it was shown that even under aerobic conditions, alcohol fermentation plays an important role in the control of the level of pyruvate in the tissue. Interestingly, alcohol fermentation appeared to be primarily induced by a drop in the energy status of the tissue rather than by a low oxygen concentration, indicating that sensing the energy status is an important component of optimizing plant metabolism to changes in the oxygen availability.


Figures

Figure 1.
Figure 1.
Profile of the oxygen concentration within pea roots. The surface of the root is indicated by 0 and the center of the root is indicated by 0.5 of relative diameter. The measurements were performed on nontreated roots (control, white circles) after 1 d of incubation in a hypoxic nutrient solution (white squares) or after 1 d of incubation in a well-aerated nutrient solution supplemented with 8 mm pyruvate (black circles). Mean ± se (n = 7–15).
Figure 2.
Figure 2.
Internal oxygen concentration (A) and respiratory rate (B) of pea roots that were grown in different nutrient solutions. The hydroponic nutrient solutions were well aerated and either used directly for the measurements (control) or supplemented with Suc, Glc, pyruvate, or succinate (final concentration 8 mm) 1 d before measuring. For the hypoxia treatment, the nutrient solution was aerated for 1 d with gas that consisted of 4% (v/v) O2, 0.035% CO2, and the rest volume N2. The values for the internal oxygen concentration represent the lowest oxygen concentration as measured in the middle of a root. Mean ± se (n = 3). Different letters mark mean values that are significantly different from each other (ANOVA; P < 0.05).
Figure 3.
Figure 3.
Rate of respiratory oxygen consumption as a function of the external oxygen concentration from roots of pea (A) and Arabidopsis (B). For the measurements, roots were kept in a hermetically closed vial in which the oxygen concentration was measured through time. Due to the respiratory activity of the tissue, oxygen depleted from the solution. Respiration rates were calculated from the raw data and plotted here against the external oxygen concentration. The graphs show the values of representative experiments that were repeated at least four times.
Figure 4.
Figure 4.
Rate of respiratory oxygen consumption as a function of the external oxygen concentration of pea roots incubated in different nutrient solutions for 1 d prior to the measurements. The concentration of the supplemented carbohydrates or organic acids was always 8 mm. □, Pyruvate; ▴, succinate; ▪, Suc; ▵, Glc. Respiration rates from roots that were not supplemented with any substrate were as shown in Figure 3. Also, the experimental details are as described for Figure 3. The graphs show the values of representative experiments that were repeated at least three times.
Figure 5.
Figure 5.
Effect of respiratory inhibitors SHAM (black symbols) and KCN (white symbols) on the rate of respiratory oxygen consumption while the oxygen availability declines. A, The full profile of respiration from full saturation (100% of air saturation) of the incubation solution to full depletion (0% of air saturation). Inhibitors were added as indicated by the arrows in the figure. The gray dotted line fits to the linear part of the graph representing the cytochrome c pathway. B, The same data as in A, but scales on the horizontal and vertical axis are adjusted such that the low oxygen response can be observed more precisely. The experimental setup is as described for Figure 3. The graphs show the values of representative experiments that were repeated at least three times.
Figure 6.
Figure 6.
Overview of the effect of hypoxia or pyruvate supplementation on various parameters that are suggested to be linked with the induction of fermentation in pea roots: internal oxygen concentration as measured in the middle of a root (A), oxygen concentration in the nutrient solution (B), PDC activity (C), ADH activity (D), the concentration of ethanol inside the root tissue (E), the concentration of acetaldehyde within the root tissue (F), the concentration of pyruvate within the root tissue (G), and the ratio of ATP to ADP as a measure for the energy status of the tissue (H). The insets in graphs C and D represent immunoblots showing the protein abundance of, respectively, PDC and ADH. Samples from the various treatments were taken 24 h (day 1) and 48 h (day 2) after addition of pyruvate to air-saturated nutrient solution (bars are labeled with pyruvate) or after switching to a nutrient solution with an oxygen concentration of 25% of air saturation (bars labeled with hypoxia). Control plants grew in air-saturated nutrient solution and samples from these plants were taken shortly before the experimental treatments started. Further control samples were taken during the course of the experiment, simultaneously with the samples taken from the various treatments. Because the control samples did not show any significant variation, the mean value of all control samples was calculated and given in the figure. The samples used for ethanol (A) or acetaldehyde (F) determination were taken 4 and 7 d after the pyruvate or hypoxic treatment started. The bars represent the average of at least three measurements ± se. Different letters mark mean values that are significantly different from each other (ANOVA; P < 0.05).
Figure 7.
Figure 7.
The impact of ADH activity in 3-week-old Arabidopsis seedlings on the levels of pyruvate (A), PEP (B), and the ratio PEP to pyruvate (B) was tested under ambient air conditions (21% [v/v] oxygen in the air; gray bars) or after 24 h of a near-anoxic treatment with air containing 1% (v/v) oxygen (white bars). The seedlings used for these analyses were growing on sterile horizontal agar-plates. The levels of pyruvate and PEP were measured in plants of the wild-type (WT) Arabidopsis accessions Be-0 and Col-0 and compared with the values measured in two independent adh mutants (adh-null in the background of Be-0, and adh in the Col-0 background). In a parallel experiment, ethanol production by the two wild-type accessions was determined (D) by measuring ethanol leakage into liquid incubation medium surrounding the seedlings, which was either aerated with ambient air, or with air containing 1% (v/v) oxygen. Multiple comparison analysis by the Holm-Sidak test following a two-way ANOVA indicated the oxygen-induced differences between the levels of pyruvate, PEP, and the PEP-to-pyruvate ratio in wild-type plants as significant (P < 0.05). Within knockout lines, all values measured were not statistically different from each other (P < 0.05). Bars represent the mean of at least three measurements ± se. Bars marked with the same letter do not differ significantly from each other. n.d., Not determined.

References

    1. Armstrong W, Strange ME, Cringle S, Beckett PM (1994) Microelectrode and modelling study of oxygen distribution in roots. Ann Bot (Lond) 74 287–299
    1. Banti V, Loreti E, Novi G, Santaniello A, Alpi A, Perata P (2008) Heat acclimation and cross-tolerance against anoxia in Arabidopsis. Plant Cell Environ 31 1029–1037 - PubMed
    1. Bailey-Serres J, Chang R (2005) Sensing and signalling in response to oxygen deprivation in plants and other organisms. Ann Bot (Lond) 96 507–518 - PMC - PubMed
    1. Bailey-Serres J, Voesenek LACJ (2008) Flooding stress: acclimations and genetic diversity. Annu Rev Plant Biol 59 313–339 - PubMed
    1. Benson BB, Krause D (1980) The concentration and isotopic fractionation of gases dissolved in freshwater in equilibrium with the atmosphere. 1. Oxygen. Limnol Oceanogr 25 662–671

Publication types