. 2008 Dec 30;105(52):20728-33.
doi: 10.1073/pnas.0808953105. Epub 2008 Dec 19.

Bidirectional Ca2+-dependent control of mitochondrial dynamics by the Miro GTPase

Affiliations

Bidirectional Ca2+-dependent control of mitochondrial dynamics by the Miro GTPase

Masao Saotome et al. Proc Natl Acad Sci U S A. .

Abstract

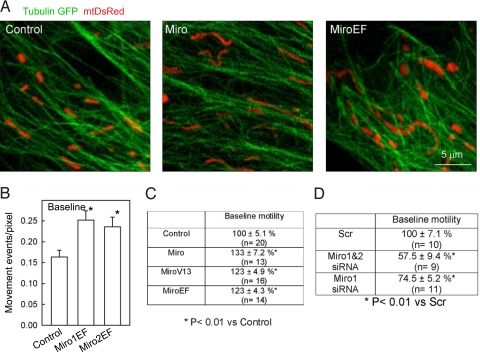
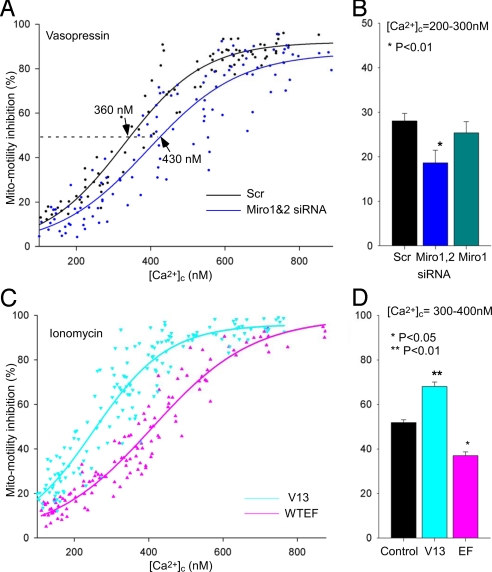
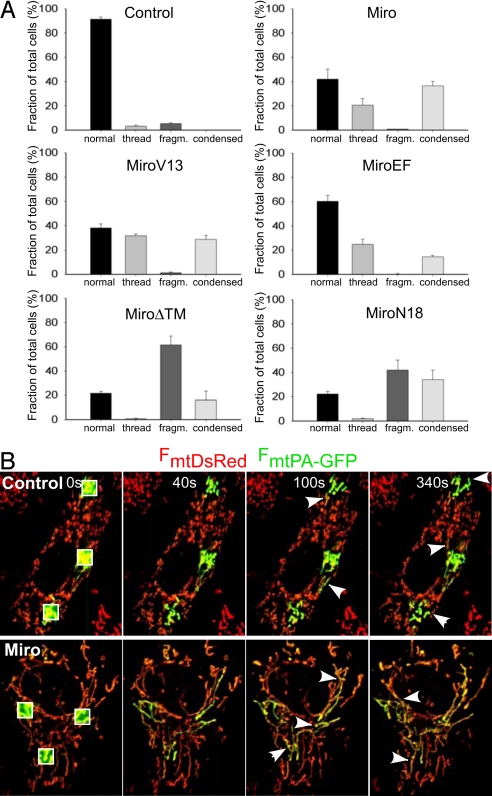
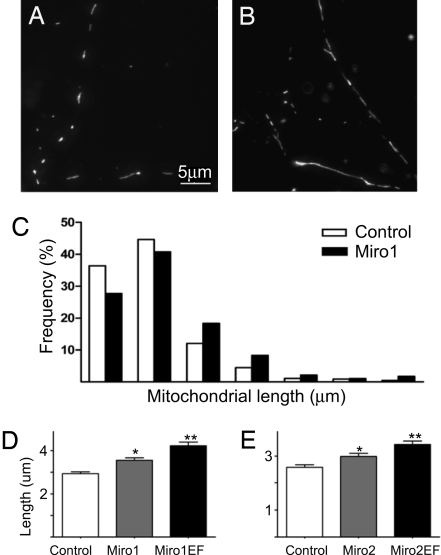
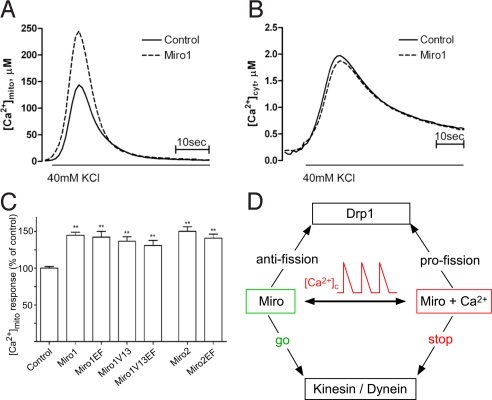
Calcium oscillations suppress mitochondrial movements along the microtubules to support on-demand distribution of mitochondria. To activate this mechanism, Ca(2+) targets a yet unidentified cytoplasmic factor that does not seem to be a microtubular motor or a kinase/phosphatase. Here, we have studied the dependence of mitochondrial dynamics on the Miro GTPases that reside in the mitochondria and contain two EF-hand Ca(2+)-binding domains, in H9c2 cells and primary neurons. At resting cytoplasmic [Ca(2+)] ([Ca(2+)](c)), movements of the mitochondria were enhanced by Miro overexpression irrespective of the presence of the EF-hands. The Ca(2+)-induced arrest of mitochondrial motility was also promoted by Miro overexpression and was suppressed when either the Miro were depleted or their EF-hand was mutated. Miro also enhanced the fusion state of the mitochondria at resting [Ca(2+)](c) but promoted mitochondrial fragmentation at high [Ca(2+)](c). These effects of Miro on mitochondrial morphology seem to involve Drp1 suppression and activation, respectively. In primary neurons, Miro also caused an increase in dendritic mitochondrial mass and enhanced mitochondrial calcium signaling. Thus, Miro proteins serve as a [Ca(2+)](c)-sensitive switch and bifunctional regulator for both the motility and fusion-fission dynamics of the mitochondria.


Conflict of interest statement

The authors declare no conflict of interest.

Figures

Fig. 1.
Fig. 1.
Miro promotes mitochondrial movements along microtubules at basal [Ca2+]c in H9c2 cells. (A) Confocal images of TubulinGFP and mtDsRed taken in control (Left), Miro1&2 (Middle), and Miro1&2EF-expressing cells (Right). (B) Actual basal mitochondrial motility values (Left) in cells transfected with mitoYFP alone or mitoYFP+Miro1EF or mitoYFP+Miro2EF. *, P < 0.01. (C) Summarized data of baseline mitochondrial motility (Mito-motility) in cells transfected with mitoYFP (Control; n = 20 cells), mitoYFP+Miro (n = 13), mitoYFP+MiroV13 (n = 16), and mitoYFP+MiroEF (n = 14). Before imaging, cells were pretreated with thapsigargin (2 μM) in a Ca2+-free ECM for 7 min to eliminate both intracellular Ca2+ mobilization and Ca2+ entry and in turn to stabilize [Ca2+]c under the basal level (≈40 nM). Data are shown as % of control. (D) Summarized data of baseline Mito-motilities in MitoYFP expressing cells transfected with either scrambled control (Scr; n = 10), Miro1-siRNA (Miro1; n = 11), or Miro1&2-siRNA (Miro1&2; n = 9). The mitochondrial movements were quantitated in a CCD time-series recorded at the resting [Ca2+]c (≈40 nM). Data present % of Scr.
Fig. 2.
Fig. 2.
MiroEF suppresses and MiroV13 promotes the VP-induced Mito-motility inhibition. (A) Actual mitochondrial motility values (Left) and [Ca2+]c (Right) during stimulation with VP (100 nM) in cells transfected with mitoYFP alone or mitoYFP+Miro1EF or mitoYFP+Miro2EF. For VP the lowest motility and highest [Ca2+]c were calculated (n = 27–33). *, P < 0.01. For motility the baseline values were shown in Fig. 1B. (B) Simultaneous measurements of Mito-motility and [Ca2+]c in H9c2 cells expressing mitoYFP (Upper) and coexpressing mitoYFP with MiroEF (Lower). Left images show mitoYFP fluorescence (grayscale); Middle and Right images show the sites of mitochondrial movement calculated by subtraction of sequential images (ΔF: change in fluorescence between the two time points; red for positive changes, green for negative changes) before and after application of 0.25 nM VP in each condition. Graphs show both [Ca2+]c (Upper) and motility inhibition in cells expressing mitoYFP (Control; black) or coexpressing mitoYFP and MiroEF (red). (C) Dose-response relationships between Mito-motility and [Ca2+]c. Vector (black, n = 58), MiroEF (pink, n = 24) and MiroV13 (cyan, n = 27) expressing cells. Mito-motility decrease during VP stimulation was normalized to baseline motility in each cell (% inhibition) and is plotted against the corresponding [Ca2+]c elevations. The IC50 and Hillslope values were in each condition: Control; 380 ± 10 nM and −4.6, V13; 300 ± 20 nM and −4.4, EF; 450 ± 20 nM and −4.5. (D) Mito-motility inhibition at the range of [Ca2+]c = 300–400 nM were calculated in Control (n = 13), V13 (n = 10), and EF (n = 11).
Fig. 3.
Fig. 3.
Effect of Miro-silencing on the VP-induced and V13, EF overexpression on Ca2+-induced mitochondrial motility inhibition (A) Dose-response relationship between [Ca2+]c and motility inhibition in Miro1&2 siRNA (blue, n = 51) and scrambled control (Scr; black, n = 41) transfected cells. The IC50 and Hillslope values were 360 ± 10 nM and −4.2 in Scr and 430 ± 20 nM and −3.6 in Miro1&2 siRNA expressing cells. (B) Summarized data of mitochondrial motility inhibition in scrambled control (n = 17), Miro1siRNA (n = 7), and Miro1&2siRNA transfected cells (n = 19) in the range of [Ca2+]c = 200–300 nM. *, P < 0.01 vs. Scr. (C) Dose-response relationship between [Ca2+]c and motility in MiroEF (pink, n = 26) and MiroV13 (cyan, n = 31) expressing cells. For the quantitative estimation of [Ca2+]c-dependent mitochondrial motility inhibition, [Ca2+]c and motility were measured in cells that were incubated in a Ca2+-free buffer supplemented with EGTA (2 mM), thapsigargin (2 μM), an inhibitor of the sarco-endoplasmic reticulum Ca2+ pump, and ionomycin (10 μM) to ensure rapid equilibration of the cytosol with the extracellular [Ca2+], and then varying amounts of CaCl2 were added. (D) Summarized data of mitochondrial motility inhibitions in Control (n = 54), V13 (n = 36), and EF expressing cells (n = 29) at the range of [Ca2+]c = 300–400 nM.
Fig. 4.
Fig. 4.
Mitochondrial morphology and fusion-fission activity in H9c2 cells overexpressing Miro constructs. (A) Mitochondrial patterns were classified (normal, thread, fragmented, and condensed) (24). H9c2 cells were transfected mitoYFP (Control), or cotransfected mitoYFP with Miro DNAs (WT; Miro1&2, V13; Miro1&2-V13, EF; Miro1&2-EF, ΔTM; Miro1&2-ΔTM, N18; Miro1&2-N18). The Myc-tagged Miro proteins were visualized by using a Myc-specific monoclonal antibody. For each experiment at least 300 cells were scored. (B) Visualization of the mitochondrial connectivity and fusion-fission activity in real time. Labeling of three subsets of mitochondria by photoactivation of PA-GFP in an H9c2 cell expressing mtPA-GFP, mtDsRed and Miro (lower row of images), MiroEF (data not shown) or pcDNA (Control, upper row of images). Irreversible photoactivation was achieved at 0 s as described in Materials and Methods. The rapid spreading (40-s images) of the mtPA-GFP fluorescence (green) indicates the matrix connectivity in the Miro and Control mitochondria. Images obtained at 100 s and 300 s illustrate several fusion events in Miro expressing cells and several fission events in the control cells.
Fig. 5.
Fig. 5.
Mitochondrial distribution and length in Miro overexpressing neurons. (A–E) mtDsRed-labeled mitochondria (grayscale) in neuronal processes of control (A) and Miro1-over-expressing (B) neurons. Wide-field fluorescence micrograph shows the best focus slice of z-stack. Panel C shows the different frequency distribution of mitochondrial lengths in the Miro1 group, compared with the control. *, P < 0.001 vs. control, **, P < 0.001 vs. control and P < 0.05 vs. Miro1 (2) wild-type group (Dunn's multiple comparison test).
Fig. 6.
Fig. 6.
Effect of Miro on [Ca2+]c and [Ca2+]m signaling in neurons. (A and B) Miro1 over-expression increases 40 mM KCl-induced [Ca2+]m uptake. Cortical cultures were cotransfected with aequorin targeted to mitochondria (A) or cytosol (B) and Miro1WT and Ca2+ uptake was measured luminometrically as described in Materials and Methods. The [Ca2+]c peak was 1.97 ± 0.16 μM in control versus 1.87 ± 0.08 μM in Miro1-overexpressing neurons (n = 8, P = 0.579). (C) Changes in mitochondrial Ca2+ uptake induced by overexpression of Miro1 and Miro2 mutants. Data presented as % of control, from 3–6 independent experiment (n ≥ 15), **, P < 0.001 vs. control group. (D) Scheme illustrating the bidirectional Ca2+-dependent control of mitochondrial motility and fusion-fission dynamics by Miro proteins.

References

    1. Rice SE, Gelfand VI. Paradigm lost: Milton connects kinesin heavy chain to miro on mitochondria. J Cell Biol. 2006;173:459–461. - PMC - PubMed
    1. Reynolds IJ, Rintoul GL. Mitochondrial stop and go: Signals that regulate organelle movement. Sci STKE. 2004;2004:PE46. - PubMed
    1. Hollenbeck PJ, Saxton WM. The axonal transport of mitochondria. J Cell Sci. 2005;118:5411–5419. - PMC - PubMed
    1. Vale RD. The molecular motor toolbox for intracellular transport. Cell. 2003;112:467–480. - PubMed
    1. Frederick RL, Shaw JM. Moving mitochondria: Establishing distribution of an essential organelle. Traffic. 2007;8:1668–1675. - PMC - PubMed

Publication types

MeSH terms

LinkOut - more resources