. 2009 Feb 13;284(7):4525-35.
doi: 10.1074/jbc.M808951200. Epub 2008 Dec 21.

TATA-binding protein variants that bypass the requirement for Mot1 in vivo

Affiliations

TATA-binding protein variants that bypass the requirement for Mot1 in vivo

Rebekka O Sprouse et al. J Biol Chem. .

Abstract

Mot1 is an essential TATA-binding protein (TBP)-associated factor and Snf2/Swi2 ATPase that both represses and activates transcription. Biochemical and structural results support a model in which ATP binding and hydrolysis induce a conformational change in Mot1 that drives local translocation along DNA, thus removing TBP. Although this activity explains transcriptional repression, it does not as easily explain Mot1-mediated transcriptional activation, and several different models have been proposed to explain how Mot1 activates transcription. To better understand the function of Mot1 in yeast cells in vivo, particularly with regard to gene activation, TBP mutants were identified that bypass the requirement for Mot1 in vivo. Although TBP has been extensively mutated and analyzed previously, this screen uncovered two novel TBP variants that are unique in their ability to bypass the requirement for Mot1. Surprisingly, in vitro analyses reveal that rather than having acquired an improved biochemical activity, one of the TBPs was defective for interaction with polymerase II preinitiation complex (PIC) components and other regulators of TBP function. The other mutant was defective for DNA binding in vitro yet was still recruited to chromatin in vivo. These results suggest that Mot1-mediated dissociation of TBP (or TBP-containing complexes) from chromatin can explain the Mot1 activation mechanism at some promoters. The results also suggest that PICs can be dynamically unstable and that appropriate PIC instability is critical for the regulation of transcription in vivo.


Figures

FIGURE 1.
FIGURE 1.
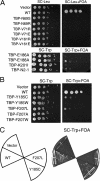
TBP Y185C and TBP F207L bypass the requirement for Mot1 in vivo. A, spot test showing a MOT1 shuffling strain transformed with either WT TBP, TBP Y185C, or TBP F207L. The strains harbored a deletion of the chromosomal copy of MOT1 and a WT MOT1 allele on a URA3-marked plasmid (26). Thus, 5-FOA selected for cells that have lost the URA3-marked copy of MOT1. Spots are 10-fold serial dilutions on synthetic media lacking tryptophan (to select for the TBP plasmids) with (bottom) and without (top) 5-FOA. B, PCR for MOT1 in pre- and post-FOA strains carrying TBP Y185C or TBP F207L as in panel A. C, Western blot of nuclear extracts of post-FOA WT, TBP Y185C, and TBP F207L strains using anti-Mot1 polyclonal antisera (26) to detect Mot1 protein. In this experiment the viability of the WT strain on FOA was maintained by transformation with a plasmid-borne copy of MOT1 on a LEU2-marked plasmid not subject to FOA counter-selection (26). The Mot1 band is indicated, which is notably absent from the bypass strains. A nonspecific band (ns) served as a loading control. D, crystal structure of the TBP·DNA complex (36) illustrating the position of Y185 (red) and F207 (yellow). TBP is shown in gray; DNA is in blue.
FIGURE 2.
FIGURE 2.
Bypass of Mot1 function by TBP Y185C and TBP F207L is allele-specific. A, spot test performed as in Fig. 1A but with other TBP alleles as indicated. Spots are 10-fold serial dilutions on synthetic media lacking leucine (top) or tryptophan (bottom) with (right) and without (left) 5-FOA. WT refers to cells harboring a wild-type copy of MOT1 not subject to 5-FOA counter-selection. Note that TBP-E188A and TBP-N2-1 bypassed Mot1 function but to a lesser degree than the alleles identified in the screen reported here. B, spot test as in panel A to test the importance of the particular TBP residue at position 185 or 207. The ability to bypass Mot1 function was specific for a cysteine at position 185 or a leucine at position 207. C, a SPT15 (TBP) shuffling strain was transformed with plasmid vector or plasmids expressing WT TBP, TBP Y185C, TBP F207L. Strains were streaked onto synthetic media lacking tryptophan and containing 5-FOA. Growth of the TBP Y185C strain on FOA-containing media shows that this allele supported viability in the absence of WT TBP, whereas TBP F207L did not.
FIGURE 3.
FIGURE 3.
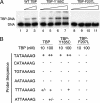
DNA binding activity of TBP Y185C and TBP F207L in vitro. A, EMSAs showing TBP·DNA complexes using radiolabeled AdMLP DNA (<1 nm) and titrations of WT TBP, TBP Y185C, or TBP F207L. Lane 1 shows free DNA. Concentrations of TBP used were 5 nm (lanes 2, 4, and 8), 10 nm (lanes 3, 5, and 9), 50 nm (lanes 6 and 10), and 100 nm (lanes 7 and 11). Comparison of lanes 2 and 3 with lanes 4 and 5 show no detectable difference in DNA binding between WT TBP and TBP Y185C. B, summary of EMSA results with alternate TATA sequences. Variations from the AdMLP TATA sequence occur in the first two base pairs where residue 207 of TBP makes critical contacts. The top strand of the probe sequence used is written on the left, and the results from reactions containing 10 or 100 nm of the indicated TBP (WT, Y185C, or F207L) are shown. - indicates no detectable binding, +/- indicates binding that was barely detectable, + indicates binding activity seen for 10 nm WT TBP to the consensus probe, and ++ indicates binding seen with 100 nm WT TBP to the consensus probe. Each binding assay was performed at least two independent times.
FIGURE 4.
FIGURE 4.
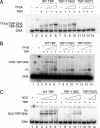
Formation of ternary complexes with TBP Y185C and TBP F207L. A, EMSA with TBP alleles and TFIIA. Increasing concentrations of TFIIA (0.5, 1.5, or 5 units indicated by ramps; TBP·DNA binding units as defined previously (65)) were added to 20 nm concentrations of the indicated TBP and DNA (<1 nm). Lane 1 shows free probe; lane 2 shows 5 units of TFIIA alone. The positions of the free DNA, TBP·DNA, and TFIIA·TBP·DNA complexes are shown. B, EMSA with TBP and TFIIB. Increasing concentrations of TFIIB (20, 40, and 100 nm indicated by ramps) were added to 20 nm TBP and DNA (<1 nm). Samples were run on a TBE gel, which allowed for better detection of TFIIB·TBP·DNA ternary complexes than the TG gels used in Figs. 3 and 4A. TBP·DNA complexes are marginally stable in this gel system; the little TBP·DNA complex that was detectable (lane 3) ran indistinguishably from the more stable (and consequently more abundant) TFIIB·TBP·DNA complex (lanes 4-6), as indicated (20). ns refers to a nonspecific complex. The reaction in lane 2 contained 100 nm TFIIB. C, EMSA with TBP and NC2. Equal concentrations of recombinant Bur6 and Ydr1 (100 ng/μl) were combined to permit assembly into the NC2 complex, then 50, 100, 200, or 400 ng of NC2 (indicated by the ramps) was added to 20 nm TBP and radiolabeled DNA as in panels A and B. Binding reactions for TBP F207L are shown only for 200 ng (lane 13) and 400 ng (lane 14) of NC2. TBP·DNA complexes were unstable in this TBE gel system. The position of the NC2·TBP·DNA complex is indicated. ho refers to higher order species as seen previously (66).
FIGURE 5.
FIGURE 5.
Summary of the genome-wide transcriptional effects of TBP Y185C and TBP F207L. A, Venn diagram depicting overlap between significantly misregulated genes (>99% confidence) in mot1-14, TBP Y185C, and TBP F207L strain data sets. B, Venn diagram showing the number of Mot1-dependent genes whose expression was restored to WT levels by TBP Y185C or TBP F207L and the overlap between the two. For panels A and B the area of the overlapping region is not proportional to the number of genes contained within that category. C, pie charts breaking down the genes in panel B according to whether they were originally Mot1-activated or Mot1-repressed and by-fold change. The numbers of genes affected less than 2-fold are shown in light blue and light red, and the numbers of genes affected greater than 2-fold are shown in dark blue and dark red, respectively. The slice of the pie is proportional to the number of genes contained within that category.
FIGURE 6.
FIGURE 6.
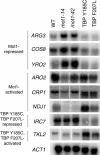
Confirmation of microarray results by Northern blotting. Genes were selected to confirm expression changes based on their regulatory patterns in mot1-14 and/or TBP Y185C and TBP F207L bypass strains. Message levels are shown for WT cells, mot1-14, and mot1-42 cells as well as the bypass strains TBP Y185C and TBP F207L. ARG3, COS8, and YRO2 are Mot1-repressed genes whose expression was restored to near WT levels in TBP Y185C and TBP F207L cells. ARO2, CRP1, and NDJ1 are Mot1-activated genes whose expression was restored to near WT levels in TBP Y185C and TBP F207L cells. IRC7 and TKL2 are genes that were misregulated in the TBP bypass strains only (repressed and activated, respectively). ACT1 is shown as a loading control.
FIGURE 7.
FIGURE 7.
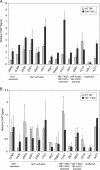
Bypass TBPs do not suppress the defect in polymerase I transcription and RNA processing observed in mot1 cells. A, Northern blot showing the levels of 35 S ribosomal RNA in the indicated strains. TBP Y185C and TBP F207L refer to the bypass strains harboring the mutant TBPs and lacking Mot1. The 35 S label on the left of the upper blot is placed next to the unprocessed ribosomal RNA species detected as previously described (29). The same blot was probed for ACT1 as a loading control. B, quantitation of Northern blots similar the one shown in panel A. Averages of RNA levels in three independent experiments ± standard deviation are shown.
FIGURE 8.
FIGURE 8.
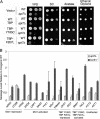
Regulation by SAGA and Bur6 in TBP Y185C and TBP F207L bypass strains. A, spot tests show 10-fold serial dilutions of WT and spt7Δ strains transformed with plasmid vector, WT TBP, TBP Y185C, or TBP F207L plasmids as indicated. Note the slow growth phenotype of spt7Δ cells seen on YPD, synthetic complete media with glucose (SC), or SC containing acetate or ethanol/glycerol rather than glucose; no observable differences were seen in growth rate whether or not the strains harbored TBP Y185C or TBP F207L. B, quantitation of Northern blots to evaluate message levels for selected genes in bur6-1 and spt7Δ strains. Values represent the -fold change in message in the indicated mutant cell compared with its congenic wild type. Results are from two independent experiments; error bars indicate the S.E. between replicates. See Fig. 6 for more information about expression patterns of ARG3, COS8, YRO2, ARO2, CRP1, NDJ1, IRC7, and TKL2. SAS3, YVC1, and TRM44 are Mot1-activated genes whose expression was affected by TBP F207L only. CHA1 expression is repressed by the bypass mutants, and SMA1 is activated by them. FCY2 and ACT1 are included as control genes unaffected by TBP Y185C or F207L.
FIGURE 9.
FIGURE 9.
Recruitment of TBP Y185C and TBP F207L to chromatin in vivo. A, ChIP of Myc-TBP (WT, gray bars) or Myc-TBP F207L (black bars) to the indicated promoters. ChIP was performed in mot1Δ strains expressing both WT TBP and TBP F207L, one of which was Myc-tagged. B, ChIP of Myc-TBP WT (gray bars) or Myc-TBP Y185C (black bars) to the indicated promoters. ChIP was performed in mot1Δ strains expressing both WT TBP and TBP Y185C, one of which was Myc-tagged. Bars in panels A and B show the average signal obtained from two independent experiments, and error bars denote the S.E. Signal is relative to the average ACT1 signal for WT TBP in the same background.

Similar articles

Cited by

References

    1. Reese, J. C. (2003) Curr. Opin. Genet. Dev. 13 114-118 - PubMed
    1. Hahn, S. (2004) Nat. Struct. Mol. Biol. 11 394-403 - PMC - PubMed
    1. Muller, F., and Tora, L. (2004) EMBO J. 23 2-8 - PMC - PubMed
    1. Matangkasombut, O., Auty, R., and Buratowski, S. (2004) Adv. Protein Chem. 67 67-92 - PubMed
    1. Hoopes, B. C., LeBlanc, J. F., and Hawley, D. K. (1992) J. Biol. Chem. 267 11539-11547 - PubMed

Publication types

MeSH terms