. 2009 Jan;15(1):50-8.
doi: 10.1038/nm.1900. Epub 2008 Dec 21.

Gamma-secretase inhibitors reverse glucocorticoid resistance in T cell acute lymphoblastic leukemia

Affiliations

Gamma-secretase inhibitors reverse glucocorticoid resistance in T cell acute lymphoblastic leukemia

Pedro J Real et al. Nat Med. 2009 Jan.

Abstract

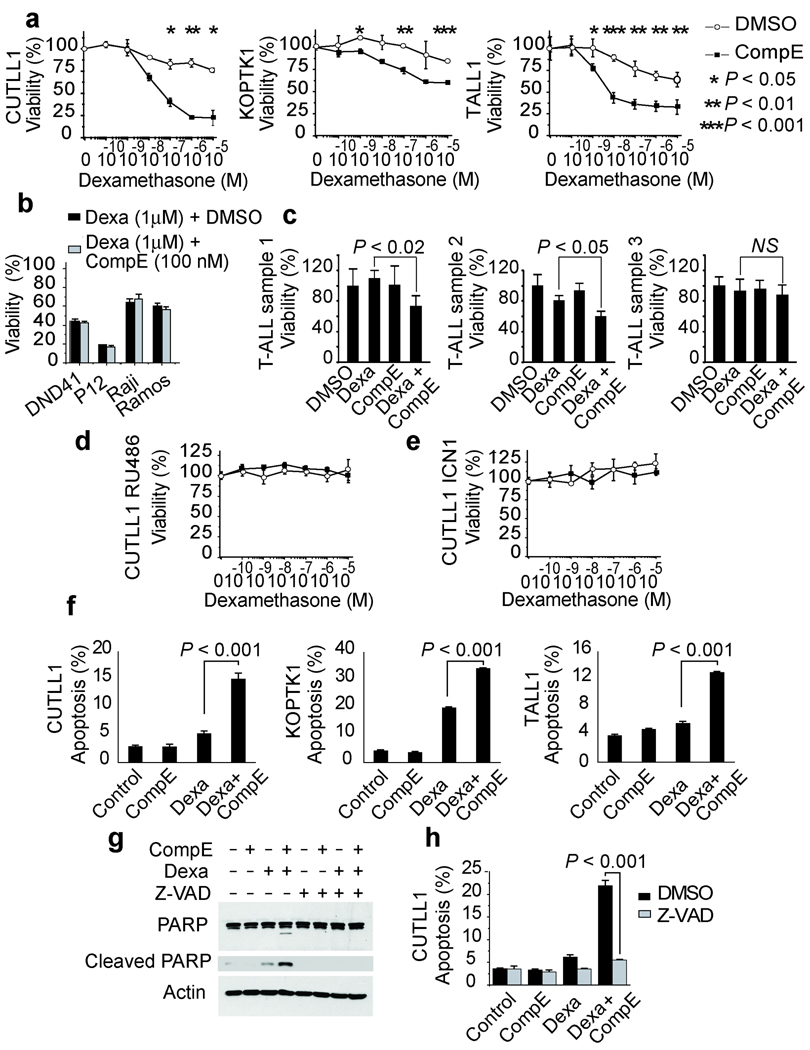
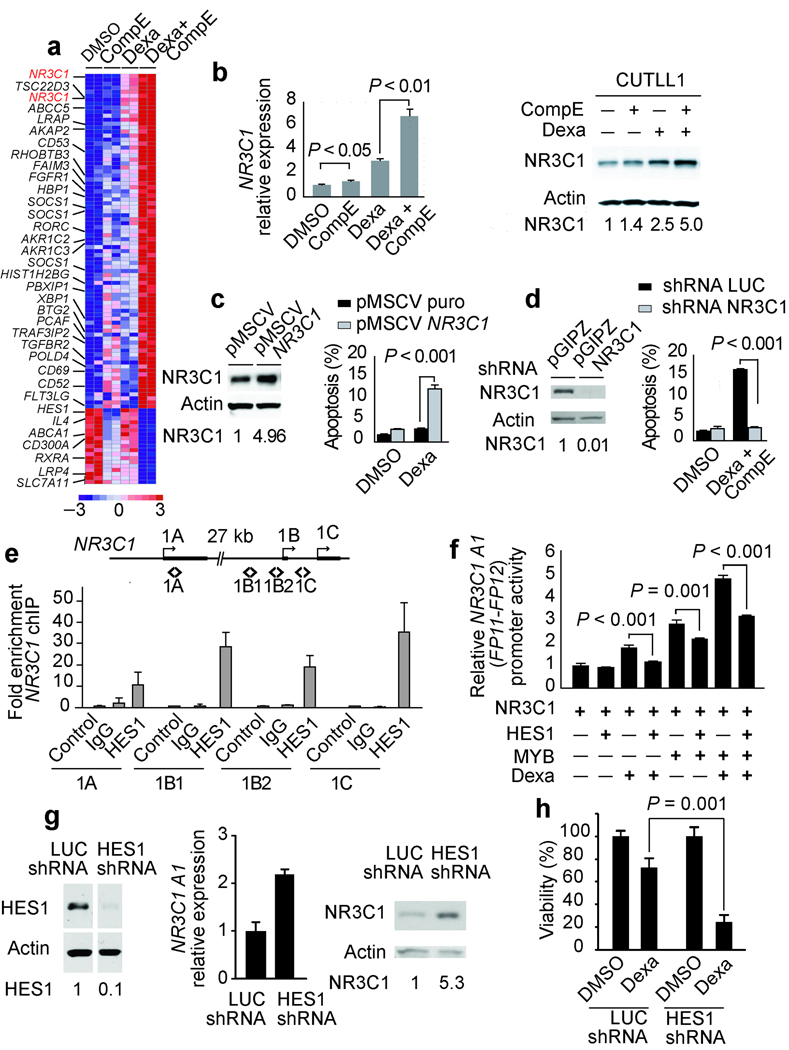
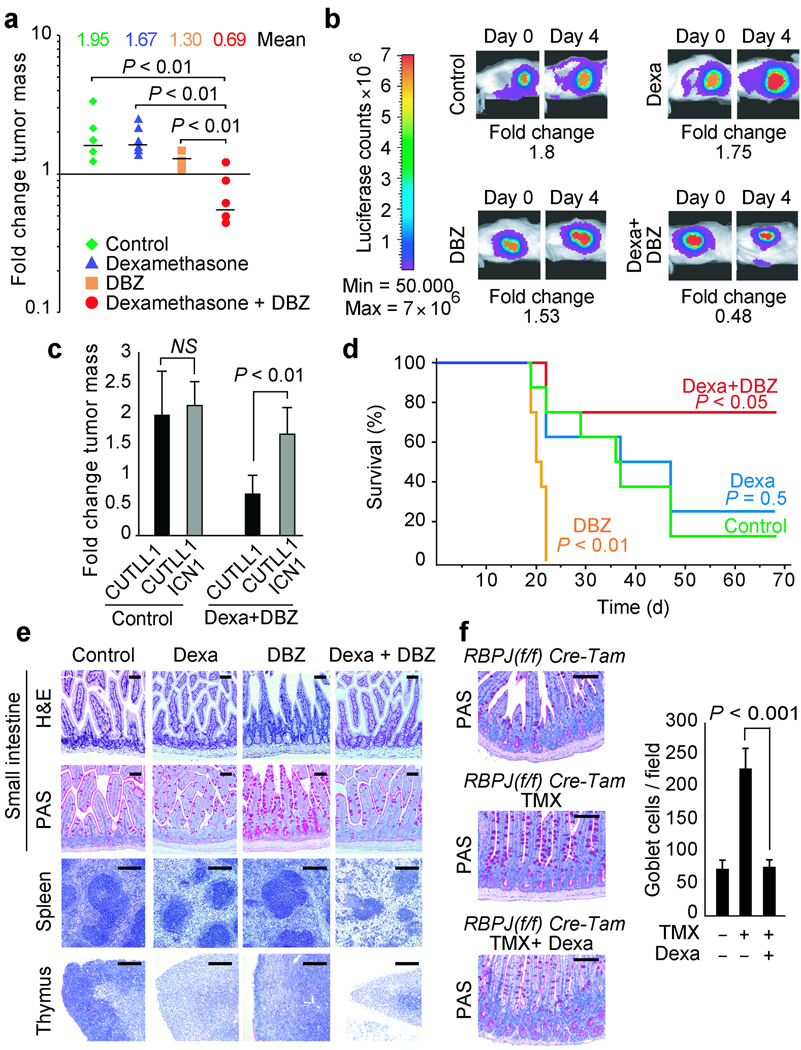
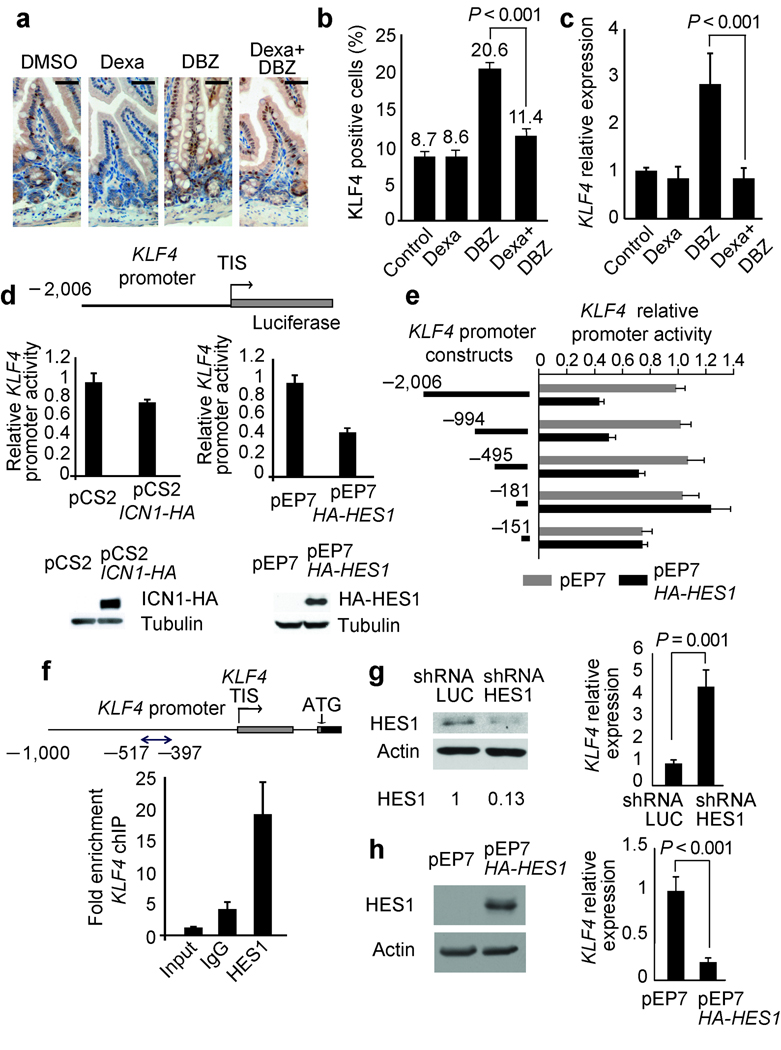
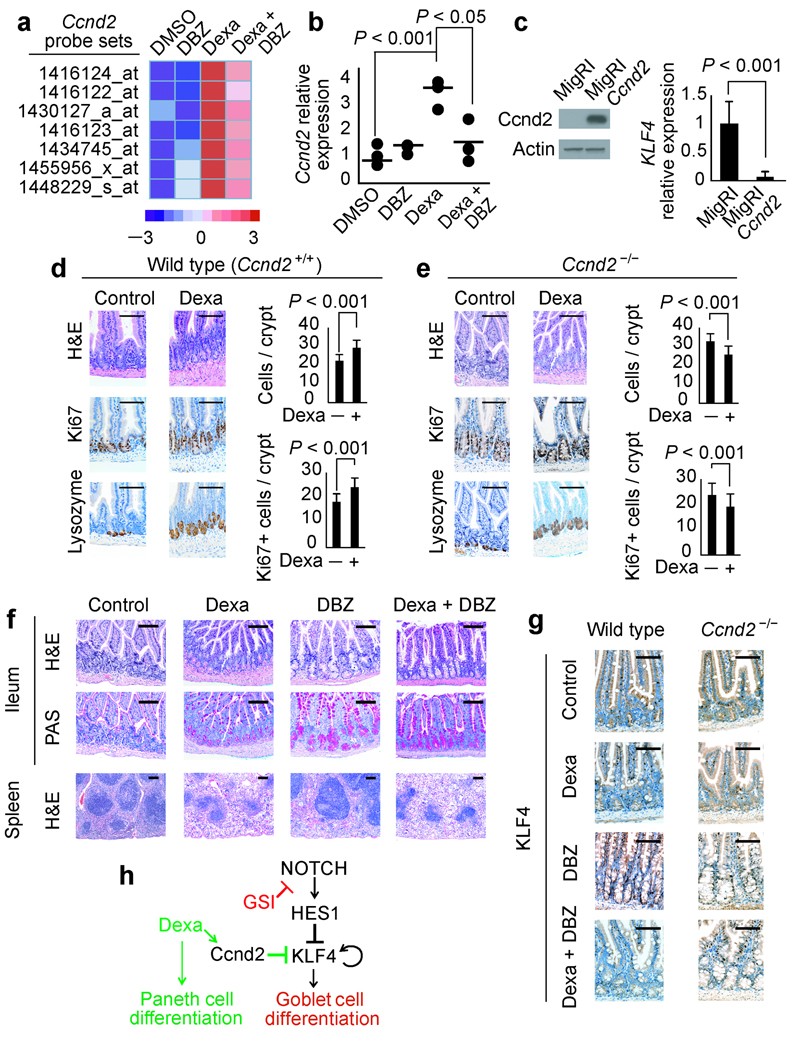
Gamma-secretase inhibitors (GSIs) block the activation of the oncogenic protein Notch homolog-1 (NOTCH1) in T cell acute lymphoblastic leukemia (T-ALL). However, limited antileukemic cytotoxicity and severe gastrointestinal toxicity have restricted the clinical application of these targeted drugs. Here we show that combination therapy with GSIs plus glucocorticoids can improve the antileukemic effects of GSIs and reduce their gut toxicity in vivo. Inhibition of NOTCH1 signaling in glucocorticoid-resistant T-ALL restored glucocorticoid receptor autoupregulation and induced apoptotic cell death through induction of the gene encoding BCL-2-like apoptosis initiator-11 (BCL2L11). GSI treatment resulted in cell cycle arrest and accumulation of goblet cells in the gut mediated by upregulation of the gene encoding the transcription factor Krüppel-like factor-4 (Klf4), a negative regulator of the cell cycle required for goblet cell differentiation. In contrast, glucocorticoid treatment induced transcriptional upregulation of cyclin D2 (Ccnd2) and protected mice from developing the intestinal goblet cell metaplasia typically induced by inhibition of NOTCH signaling with GSIs. These results support a role for glucocorticoids plus GSIs in the treatment of glucocorticoid-resistant T-ALL.


Figures

Figure 1
Figure 1
GSIs reverse glucocorticoid resistance in T-ALL cells. (a) Viability assays in the glucocorticoid-resistant T-ALL cell lines CUTLL1 (72 h), KOPTK1 (48 h) and TALL1 (72 h) treated with 100nM CompE (black squares) or vehicle only (open circles) plus increasing concentrations of dexamethasone. (b) Analysis of T-ALL cell lines sensitive to glucocorticoids (DND41, P12 ICHIKAWA) or B-lineage cell lines (Raji and Ramos). (c) Analysis of in primary T-ALL samples resistant to glucocorticoids. (d) Analysis of CUTLL1 cells treated with glucocorticoid receptor antagonist RU486 (1 µM). (e) Analysis of CUTLL1 cells expressing constitutively active intracellular NOTCH1 (ICN1). (f) Percentage of apoptotic cells (annexinV positive/PI negative) in CUTLL1 (72 h), KOPTK1 (48 h) and TALL1 cells (72 h) treated with DMSO (control), CompE (100 nM), dexamethasone (1 µM) and dexamethasone ( 1 µM) plus CompE (100 nM). (g,h) Inhibition of apoptosis induction by dexamethatosone plus CompE cotreatment by the Z-VAD caspase inhibitor as demonstrated by inhibition of PARP cleavage by Western blot (g) and decreased annexinV positive/PI negative cells by flow cytometry (h). Data in a-f and h are means ± SD of triplicate experiments. Statistical significance was assessed with Student’s t-test.
Figure 2
Figure 2
Inhibition of NOTCH1-HES1 signaling restores glucocorticoid receptor autoregulation. (a) Microarray gene expression changes in CUTLL1 cells at 24 h treated with DMSO, CompE, dexamethasone and CompE plus dexamethasone. Relative expression levels are color coded as indicated at the bottom. (b) Quantitative RT-PCR analysis of the glucocorticoid receptor gene (NR3C1) and Western blot analysis and quantitation of glucocorticoid receptor protein levels in CUTLL1 cells treated with dexamethasone and CompE compared with vehicle only (DMSO). (c) Western blot analysis of NR3C1 levels and induction of apoptosis by dexamethasone and CompE in CUTLL1 cells infected with retroviruses expressing the glucocorticoid receptor (pMSCV NR3C1). (d) Analysis of apoptosis induction by dexamethasone plus CompE in CUTLL1 cells infected with shRNA lentiviruses targeting the glucocorticoid receptor (pGIPZ NR3C1) (e) Quantitative ChIP analysis of HES1 binding to NR3C1 promoter sequences. (f) Effects of HES1, MYB and dexamethasone (1 µM) in the activity of a human NR3C1 A1 reporter. Luciferase activity is shown relative to an internal control expressing Renilla luciferase. (g,h) NR3C1 expression (g) and analysis of apoptosis (h) in CUTLL1 cells treated with dexamethasone and CompE after lentiviral shRNA knockdown of HES1 (HES1 shRNA). A shRNA targeting the luciferase gene (shRNA LUC) was used as control. Drug concentrations in a–c were CompE 100 nM and dexamethasone 1 µM. Bars represent means ± SD of triplicate experiments. Statistical significance was assessed with Student’s t-test. HES1 and NR3C1 relative protein levels are indicated at the bottom of corresponding lanes in the Western blot.
Figure 3
Figure 3
BIM upregulation reverses glucocorticoid resistance in T-ALL cells treated with dexamethasone plus CompE. (a, b) Quantitative RT-PCR analysis of the BH3-only factors BIM (a) and BMF (b) in CUTLL1 cells treated with dexamethasone and/or CompE compared with vehicle only (DMSO). Relative expression levels are shown normalized to those of vehicle-only controls. (c) Western blot analysis and quantitation of BIM and BMF in CUTLL1 cells treated with dexamethasone and/or CompE compared with vehicle only (DMSO). (d) Western blot analysis of BIM following sRNA knock down. CUTLL1 cells infected with control lentivirus targeting the luciferase gene (pLKO LUC) or BIM (pLKO BIM) were treated with vehicle only or dexamethasone plus CompE for 24 hours and analyzed by Western blotting. (e) Induction of apoptosis in control (pLKO LUC infected) and BIM knockdown (pLKO BIM infected) cells treated with dexamethasone plus CompE. (f) Western blot analysis of BMF by shRNA knock down. CUTLL1 cells infected with control lentivirus targeting the luciferase gene (pLKO LUC) or BMF (pLKO BMF) were treated with vehicle only or dexamethasone plus CompE for 24 hours and analyzed by Western blot. (g) Induction of apoptosis in control (pLKO LUC infected) and BMF knockdown (pLKO BMF-infected) cells treated with dexamethasone plus CompE. Apoptosis refers to the percentage of annexin V positive/PI negative cells. (h) Schematic representation of the transcriptional regulatory network controlling glucocorticoid receptor autoregulation downstream of NOTCH1 and dexamethasone-induced apoptosis upon inhibition of NOTCH1 signaling via GSI treatment.
Figure 4
Figure 4
Interaction of NOTCH inhibition and dexamethasone treatment in tumor response and gut toxicity in vivo. (a) Bioimaging quantitation of tumor mass changes in subcutaneous CUTLL1 T-ALL xenografts in mice treated with vehicle (control), dexamethasone, GSI (DBZ) or GSI plus dexamethasone (Dexamethasone + DBZ) for 4 days. (b) Representative examples of bioluminiscence in vivo imaging showing changes in tumor load in representative mice (animals with closest values to the median are shown) treated with vehicle (control), dexamethasone (Dexa), DBZ and dexamethasone plus DBZ (Dexa + DBZ). (c) Tumor mass changes induced by dexamethasone plus DBZ treatment compared to controls in CUTLL1 T-ALL xenografts (CUTLL1) and CUTLL1 xenografts expressing an intracellular form of NOTCH1 (CUTLL1 ICN1), which does not require γ-secretase cleavage for activation. (d) Kaplan-Meier plot of overall survival among mice treated with vehicle (Control), dexamethasone, DBZ or DBZ plus dexamethasone after xenograft transplantation of human T-ALL cells via tail vein injection. (e) Histological analysis of small intestine, spleen and thymus from mice treated with vehicle, dexamethasone, DBZ and dexamethasone plus DBZ for 5 days. (f) Goblet cell analysis and quantitation in the ileum of RBPJ(fl/fl) Cre-Tam conditional knockout mice in basal conditions (RBPJ(fl/fl) Cre-Tam), following conditional deletion of CSL/RBPJ with tamoxifen (RBPJ(fl/fl) Cre-Tam TMX) and upon conditional deletion of CSL/RBPJ followed by dexamethasone treatment (RBPJ(fl/fl) Cre-Tam TMX + Dexa). TMX: tamoxifen. H&E: haemotoxylin and eosin staining. Scale bars represent 100 µm in the intestine and 400 µm in spleen and thymus.
Figure 5
Figure 5
NOTCH-HES1 signaling regulates KLF4 expression in the gut. (a,b) Immunohistochemistry analysis of Klf4 expression in small intestine of mice treated with dexamethasone, DBZ or the combination of dexamethasone plus DBZ for 5 days. Scale bars represent 100 µm. (c) Real-time PCR analysis of Klf4 transcript levels in small intestine of mice treated with dexamethasone, DBZ or the combination of dexamethasone plus DBZ for 10 days. Gapdh levels were used as a reference control. Data are means ± SD of three animals per group. (d–e) Effects of ICN1 and HES1 expression in human KLF4 promoter activity. Luciferase reporter assays were performed in AGS cells with reporter constructs encompassing 2,006 bp (d, e), 994, 495 and 181 nucleotides (e) of the KLF4 promoter. Promoter activity is shown relative to an internal control expressing Renilla luciferase. Western blot shows expression of ICN1-HA and HA-HES1 proteins in AGS cells transfected with ICN1 and HES1 expression plasmids. (f) Quantitative ChIP analysis of HES1 binding to KLF4 promoter sequences. (g) Lentiviral shRNA knockdown of HES1 in AGS cells induces transcriptional upregulation of KLF4. (h) Expression of HA-HES1 protein in AGS cells induces transcriptional downregulation of KLF4. Expression of a control shRNA targeting the luciferase gene (shRNA LUC) was used as control. Bars represent means ± SD of triplicate experiments. TIS: transcription initiation site. HES1 protein levels normalized to the loading control are shown at the bottom of corresponding lanes in the Western blot.
Figure 6
Figure 6
Glucocorticoid-induced Cnnd2 upregulation mediates the enteroprotective effect of dexamethasone against GSI-induced gut toxicity. (a) Microarray analysis of Ccnd2 transcript levels in the small intestine of mice treated with vehicle (DMSO), DBZ, dexamethasone (Dexa) and dexamethasone plus DBZ (Dexa + DBZ) for 5 days. The heat map diagram shows average values from duplicate samples. (b) Quantitative RT-PCR analysis of the Ccnd2 gene in the small intestine of mice treated with vehicle (DMSO), DBZ, dexamethasone (Dexa) and dexamethasone plus DBZ (Dexa + DBZ). Horizontal bars indicate the mean expression level in each group. (c) Retroviral expression of Ccnd2 in AGS cells induces transcriptional downregulation of KLF4. (d, e) Histological and histochemical analysis of small intestines from wild type (d) and Ccnd2−/− mice (e) treated with vehicle only (Control) or dexamethasone (Dexa). (f) Histological and histochemical studies of small intestines and spleens from Ccnd2−/− mice treated with vehicle only (DMSO), dexamethasone, DBZ and dexamethasone plus DBZ for 10 days. H&E: haemotoxylin and eosin staining. Scale bars represent 100 µm. (g) Immunohistochemistry analysis of Klf4 expression in small intestine of wild type and Ccnd2−/− mice treated with dexamethasone, DBZ or the combination of dexamethasone plus DBZ for 5 days. Scale bars represent 100 µm. (h) Schematic representation of the transcriptional regulatory network controlling cell differentiation in the intestinal cells downstream of Notch and glucocorticoid receptor signaling.

Comment in

Similar articles

Cited by

References

    1. Evin G, Sernee MF, Masters CL. Inhibition of gamma-secretase as a therapeutic intervention for Alzheimer's disease: prospects, limitations and strategies. CNS Drugs. 2006;20:351–372. - PubMed
    1. Selkoe D, Kopan R. Notch and Presenilin: regulated intramembrane proteolysis links development and degeneration. Annu Rev Neurosci. 2003;26:565–597. - PubMed
    1. Weng AP, et al. Activating mutations of NOTCH1 in human T cell acute lymphoblastic leukemia. Science. 2004;306:269–271. - PubMed
    1. Roy M, Pear WS, Aster JC. The multifaceted role of Notch in cancer. Curr Opin Genet Dev. 2007;17:52–59. - PubMed
    1. Deangelo D, et al. A phase I clinical trial of the notch inhibitor MK-0752 in patients with T-cell acute lymphoblastic leukemia/lymphoma (T-ALL) and other leukemias. Journal of Clinical Oncology, 2006 ASCO Annual Meeting Proceedings Part I. 2006;24:6585.

Publication types

MeSH terms

Associated data