. 2009 Jan;41(1):66-70.
doi: 10.1038/ng.303. Epub 2008 Dec 21.

Accelerated genetic drift on chromosome X during the human dispersal out of Africa

Affiliations

Accelerated genetic drift on chromosome X during the human dispersal out of Africa

Alon Keinan et al. Nat Genet. 2009 Jan.

Abstract

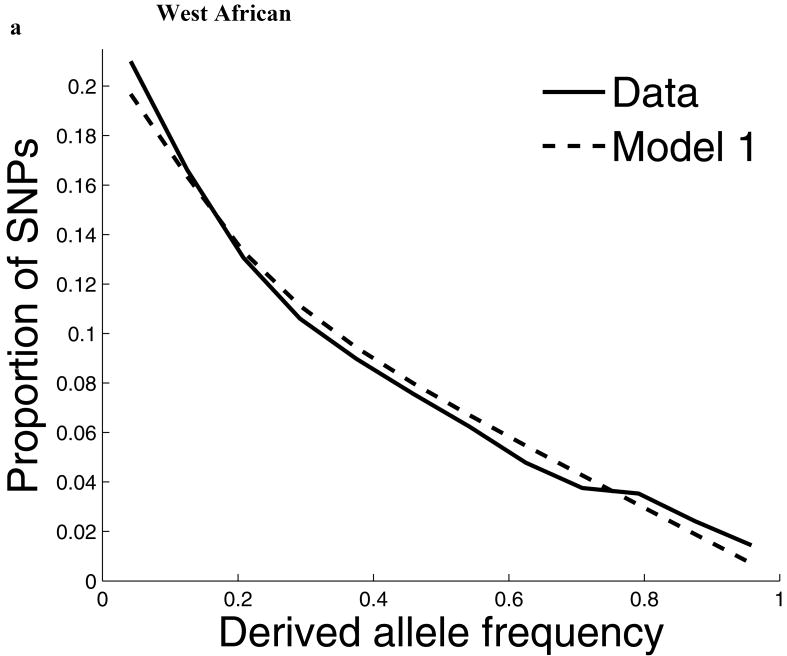
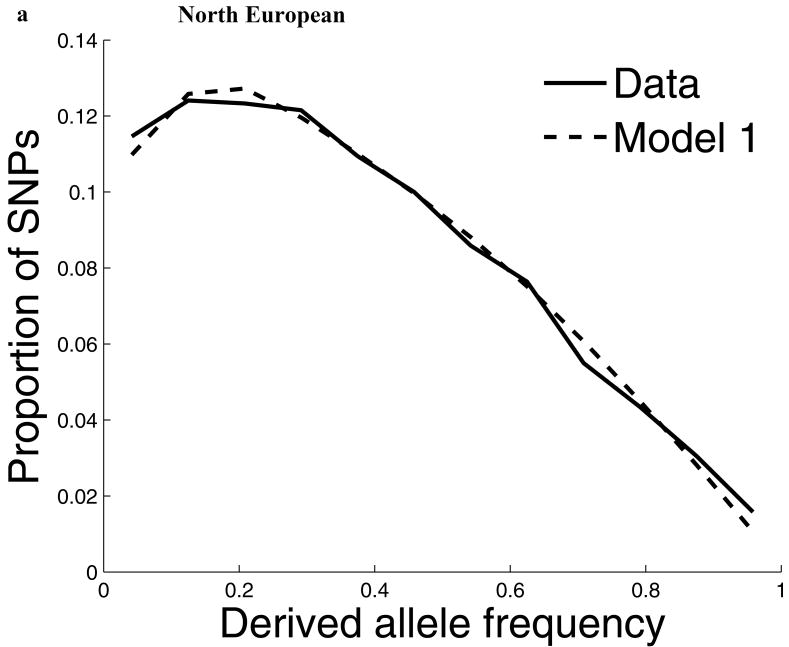
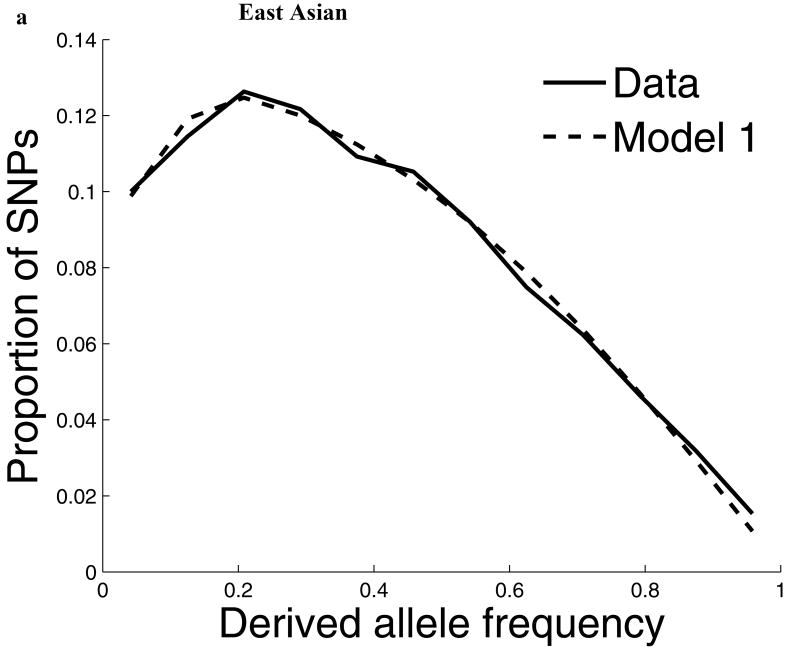
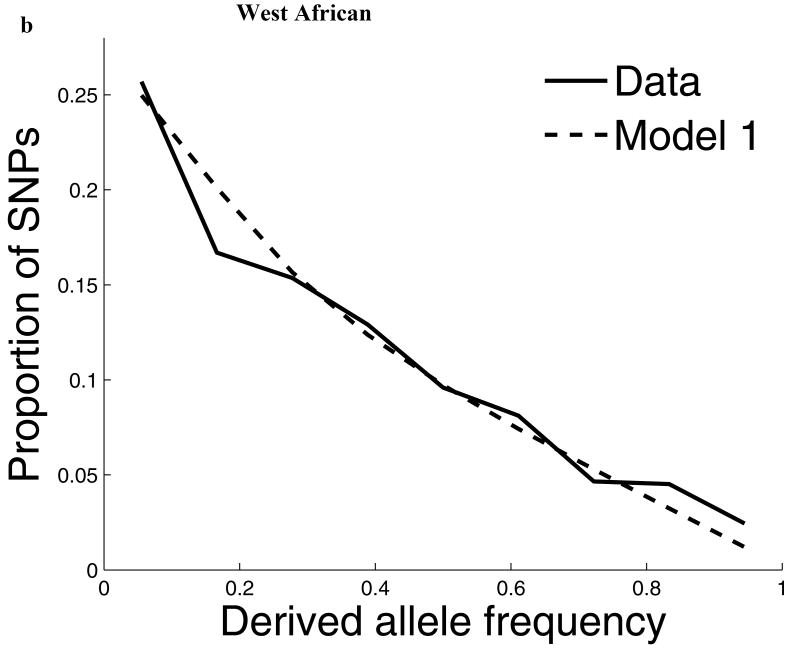
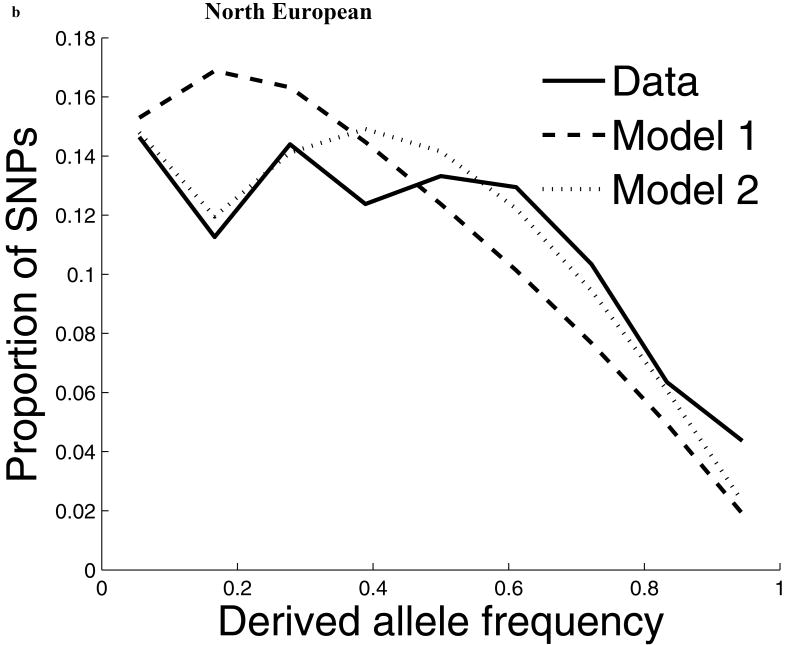
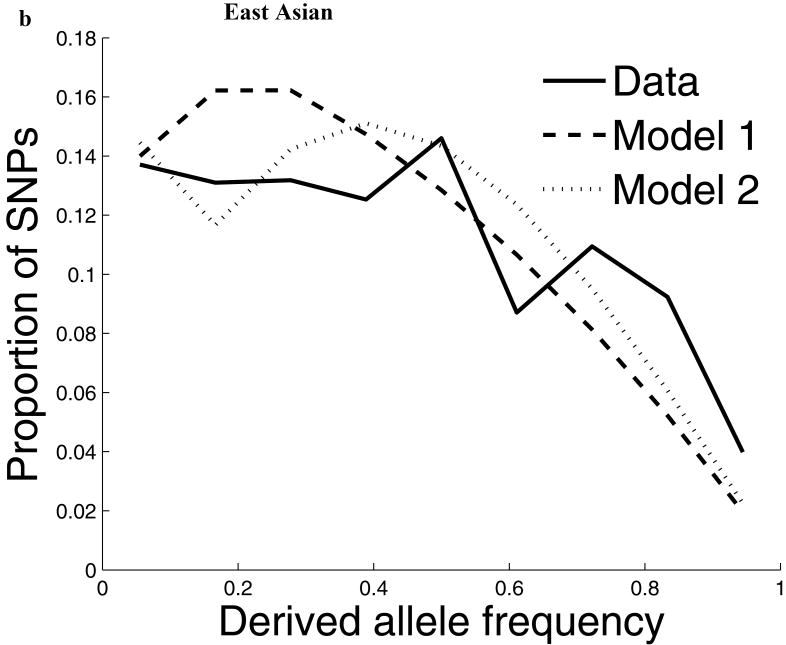
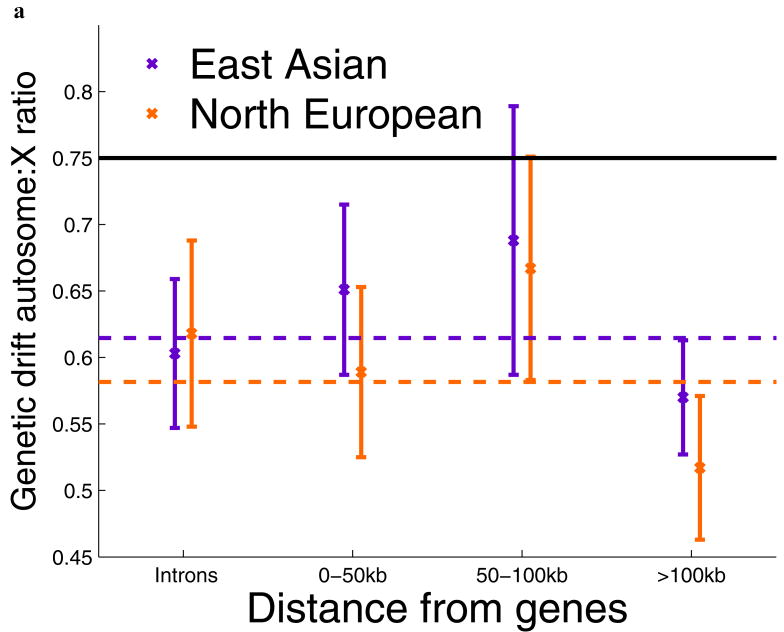
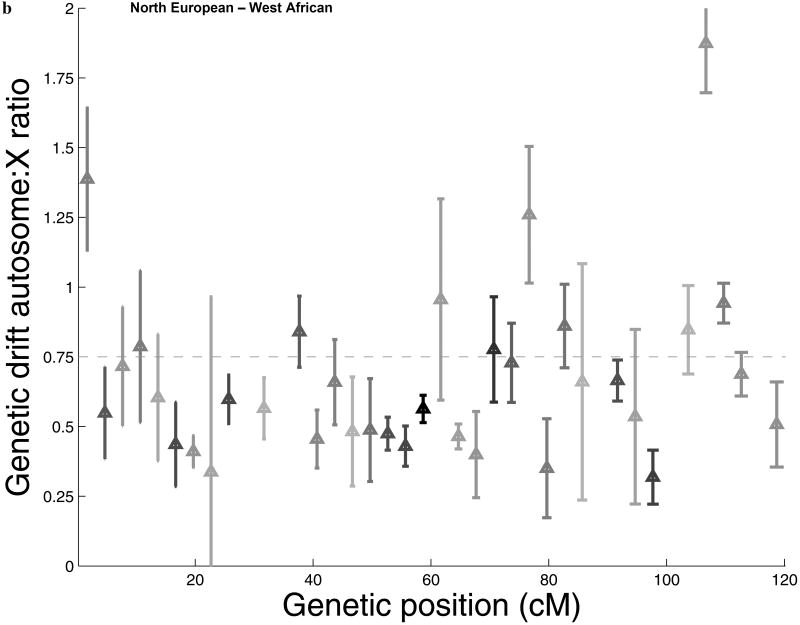
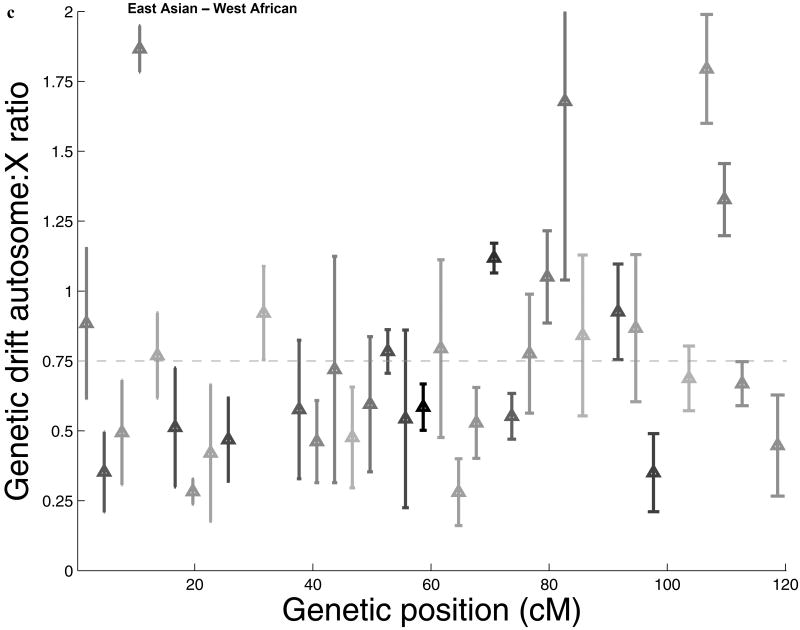
Comparisons of chromosome X and the autosomes can illuminate differences in the histories of males and females as well as shed light on the forces of natural selection. We compared the patterns of variation in these parts of the genome using two datasets that we assembled for this study that are both genomic in scale. Three independent analyses show that around the time of the dispersal of modern humans out of Africa, chromosome X experienced much more genetic drift than is expected from the pattern on the autosomes. This is not predicted by known episodes of demographic history, and we found no similar patterns associated with the dispersals into East Asia and Europe. We conclude that a sex-biased process that reduced the female effective population size, or an episode of natural selection unusually affecting chromosome X, was associated with the founding of non-African populations.


Figures

Figure 1
Figure 1
The distribution of allele frequencies on chromosome X does not match the expectation from the autosomes in non-African populations. (a) Distribution of derived allele frequencies on the autosomes compared with the expectation for our best fit models of history, for SNPs discovered in two chromosomes of an ancestry and then genotyped in a larger number of samples of the same ancestry from HapMap. Derived allele refers to the new mutation, which we infer by requiring that both chimpanzee and orangutan match the other allele. (b) Analogous plots for chromosome X compare the observed data to the expectation from the autosomal best fit models after rescaling all effective population sizes by ¾ (‘Model 1’). While the fit of the model to the chromosome X data is excellent for West Africans, the fit of the models is poor in North Europeans and East Asians, both of which exhibit more high derived allele frequencies than expected from the models. ‘Model 2’ separately fits the out-of-Africa bottleneck on chromosome X, resulting in a more intense bottleneck than is expected from the autosomes even after adjusting for the ¾ expected difference in population size (Supp. Note). The fit to the observed data is greatly improved in Model 2 compared to Model 1, with mean squared errors reduced by 79% for North Europeans and 34% for East Asians. (The panels in this figure use different scales reflecting the numbers of sampled chromosomes used in each analysis; modeling adjusts for the differences in sample size.8)
Figure 1
Figure 1
The distribution of allele frequencies on chromosome X does not match the expectation from the autosomes in non-African populations. (a) Distribution of derived allele frequencies on the autosomes compared with the expectation for our best fit models of history, for SNPs discovered in two chromosomes of an ancestry and then genotyped in a larger number of samples of the same ancestry from HapMap. Derived allele refers to the new mutation, which we infer by requiring that both chimpanzee and orangutan match the other allele. (b) Analogous plots for chromosome X compare the observed data to the expectation from the autosomal best fit models after rescaling all effective population sizes by ¾ (‘Model 1’). While the fit of the model to the chromosome X data is excellent for West Africans, the fit of the models is poor in North Europeans and East Asians, both of which exhibit more high derived allele frequencies than expected from the models. ‘Model 2’ separately fits the out-of-Africa bottleneck on chromosome X, resulting in a more intense bottleneck than is expected from the autosomes even after adjusting for the ¾ expected difference in population size (Supp. Note). The fit to the observed data is greatly improved in Model 2 compared to Model 1, with mean squared errors reduced by 79% for North Europeans and 34% for East Asians. (The panels in this figure use different scales reflecting the numbers of sampled chromosomes used in each analysis; modeling adjusts for the differences in sample size.8)
Figure 2
Figure 2
Gene-centric natural selection, or natural selection localized to specific regions of chromosome X, fail to explain the signal of accelerated genetic drift. (a) Dividing the chromosome X and autosome data sets based on distance from the nearest gene, we find no evidence that the ratio of autosome-to-X genetic drift Q between West Africans and East Asians and between West Africans and North Europeans increases with distance, as would be expected if selection explains our results. In particular, the bin furthest from genes (>100kb) is significantly below the expectation of ¾ (horizontal black line; error bars indicate ±1 standard error). Dotted lines show the values for all data for comparison to the individual bins. A related plot for the sequence diversity data also shows no significant effect of distance from genes (Supp. Figure 2). (b,c) The ratio of autosome-to-X genetic drift Q between West Africans and (b) North Europeans (c) East Asians, presented spatially across chromosome X. For each of 40 bins 3 cM in size on chromosome X, Q is presented as the reciprocal of the ratio of genetic drift in that bin to the average across the autosomes. A triangle's gray level indicates the number of SNPs in the bin, which is between 15 and 60 (bins with fewer than 15 SNPs are excluded from the figure). Error bars indicate one standard error below and above Q, which we obtain by a jackknife over 5 windows of 0.6 cM. The reduction of Q below the expectation of ¾ (horizontal line) has a complex pattern. However, it is widely distributed across chromosome X rather than being localized to a few regions. This rules out the possibility that the signal of accelerated drift on chromosome X can be explained by selection at a small number of loci.
Figure 2
Figure 2
Gene-centric natural selection, or natural selection localized to specific regions of chromosome X, fail to explain the signal of accelerated genetic drift. (a) Dividing the chromosome X and autosome data sets based on distance from the nearest gene, we find no evidence that the ratio of autosome-to-X genetic drift Q between West Africans and East Asians and between West Africans and North Europeans increases with distance, as would be expected if selection explains our results. In particular, the bin furthest from genes (>100kb) is significantly below the expectation of ¾ (horizontal black line; error bars indicate ±1 standard error). Dotted lines show the values for all data for comparison to the individual bins. A related plot for the sequence diversity data also shows no significant effect of distance from genes (Supp. Figure 2). (b,c) The ratio of autosome-to-X genetic drift Q between West Africans and (b) North Europeans (c) East Asians, presented spatially across chromosome X. For each of 40 bins 3 cM in size on chromosome X, Q is presented as the reciprocal of the ratio of genetic drift in that bin to the average across the autosomes. A triangle's gray level indicates the number of SNPs in the bin, which is between 15 and 60 (bins with fewer than 15 SNPs are excluded from the figure). Error bars indicate one standard error below and above Q, which we obtain by a jackknife over 5 windows of 0.6 cM. The reduction of Q below the expectation of ¾ (horizontal line) has a complex pattern. However, it is widely distributed across chromosome X rather than being localized to a few regions. This rules out the possibility that the signal of accelerated drift on chromosome X can be explained by selection at a small number of loci.

Comment in

Similar articles

Cited by

References

    1. Hammer MF, et al. Heterogeneous patterns of variation among multiple human x-linked Loci: the possible role of diversity-reducing selection in non-Africans. Genetics. 2004;167:1841–53. - PMC - PubMed
    1. Hammer MF, Mendez FL, Cox MP, Woerner AE, Wall JD. Sex-biased evolutionary forces shape genomic patterns of human diversity. PLoS Genet. 2008;4:e1000202. - PMC - PubMed
    1. The International HapMap Consortium. A second generation human haplotype map of over 3.1 million SNPs. Nature. 2007;449:851–861. - PMC - PubMed
    1. Li JZ, et al. Worldwide human relationships inferred from genome-wide patterns of variation. Science. 2008;319:1100–4. - PubMed
    1. Akey JM, Zhang G, Zhang K, Jin L, Shriver MD. Interrogating a high-density SNP map for signatures of natural selection. Genome Res. 2002;12:1805–14. - PMC - PubMed

Publication types