. 2009 Jan;22(1):118-28.
doi: 10.1021/tx800253x.

Urine metabolites reflect time-dependent effects of cyclosporine and sirolimus on rat kidney function

Affiliations

Urine metabolites reflect time-dependent effects of cyclosporine and sirolimus on rat kidney function

Jost Klawitter et al. Chem Res Toxicol. 2009 Jan.

Abstract

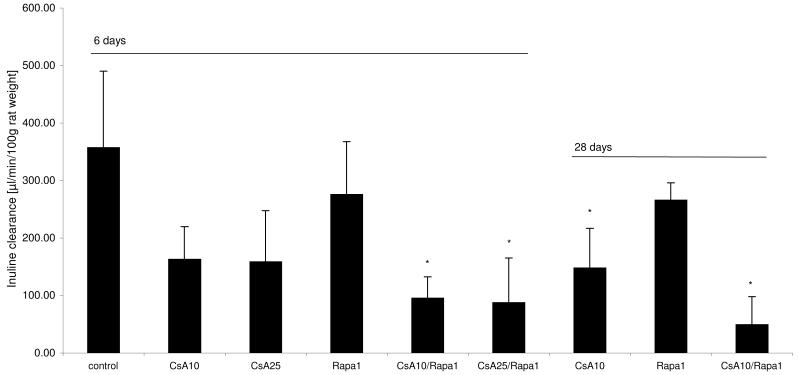
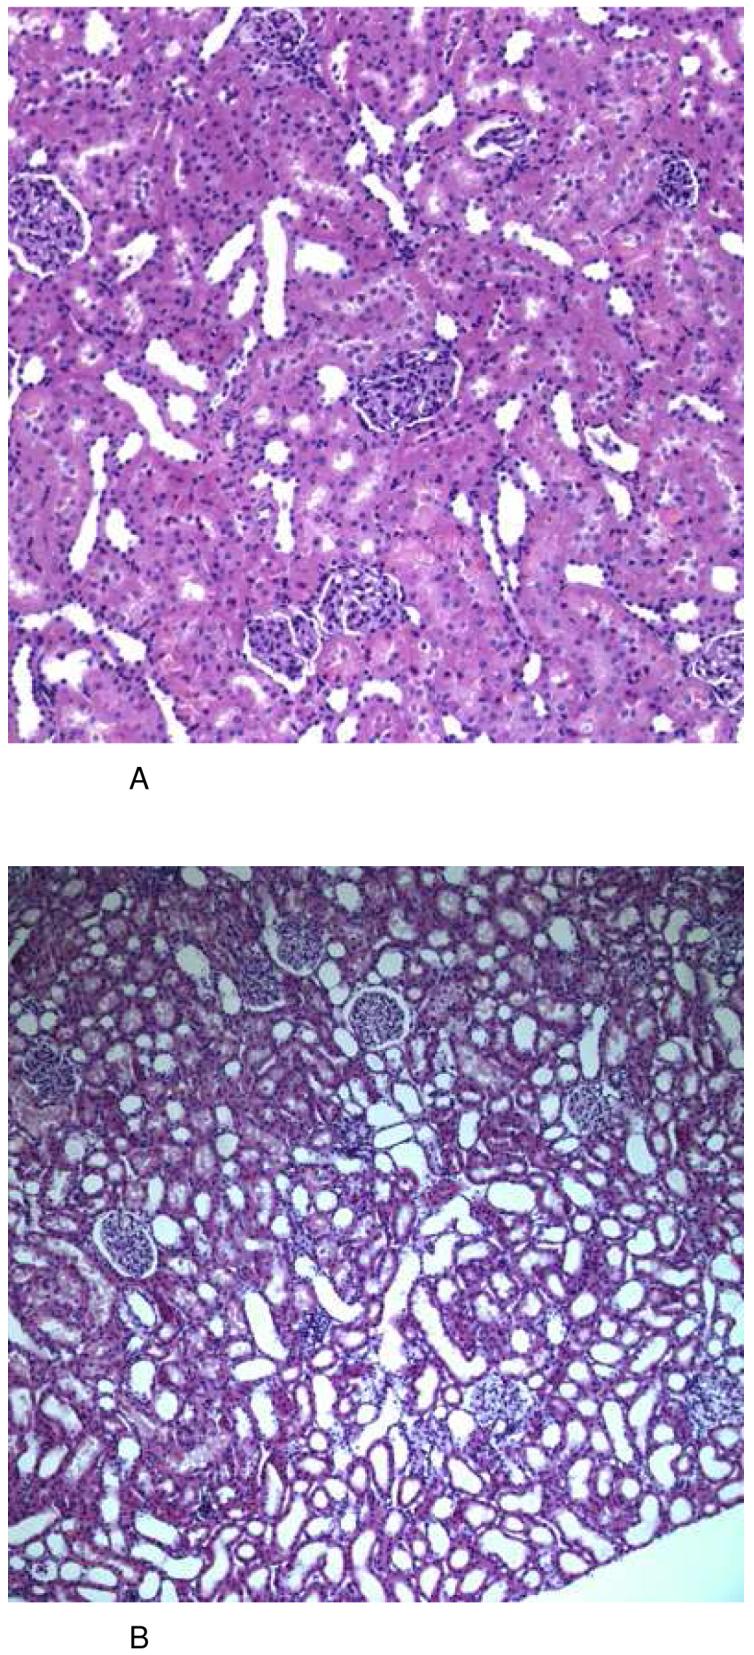
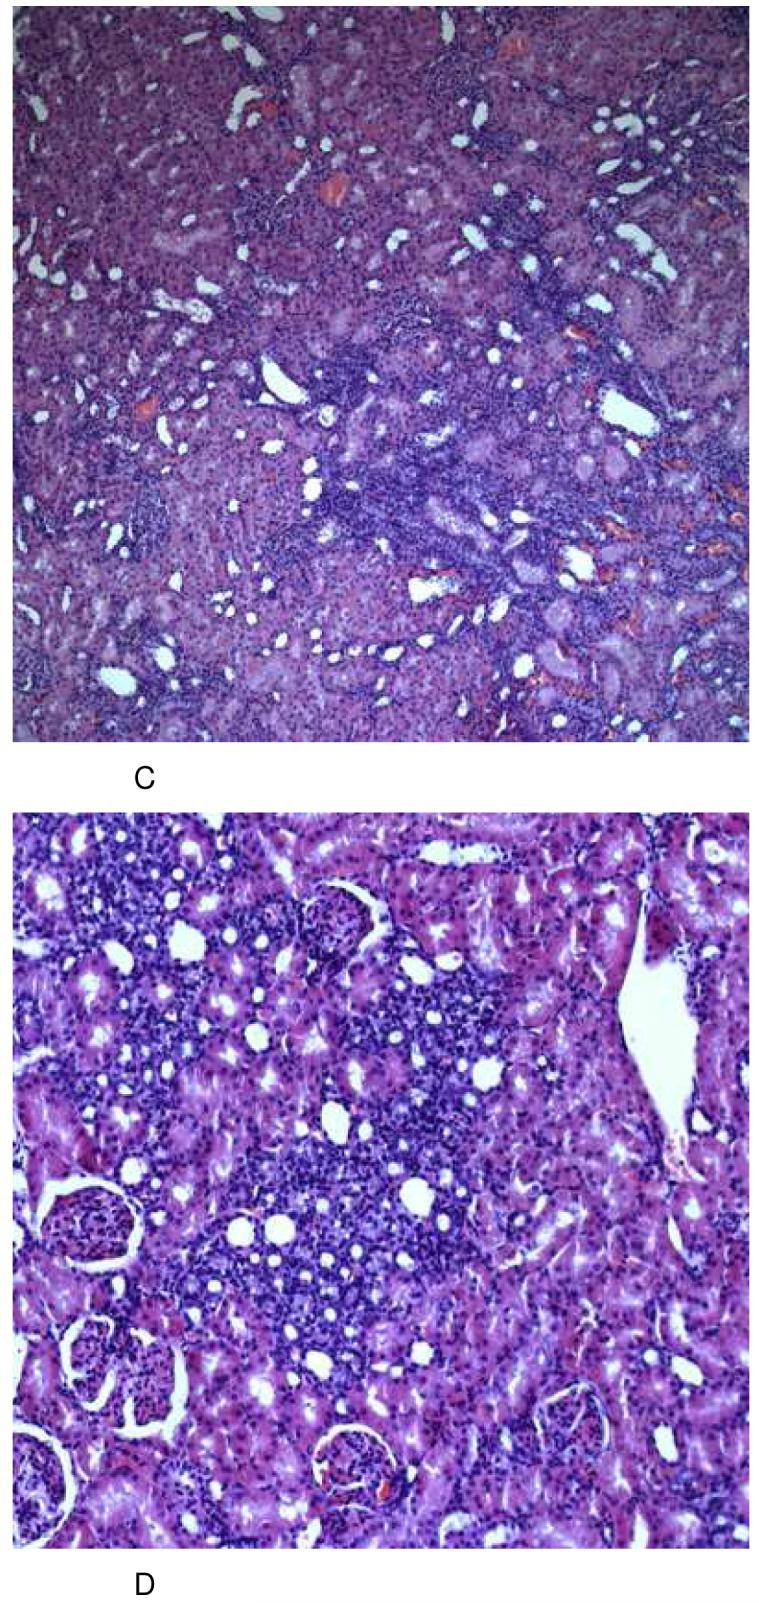
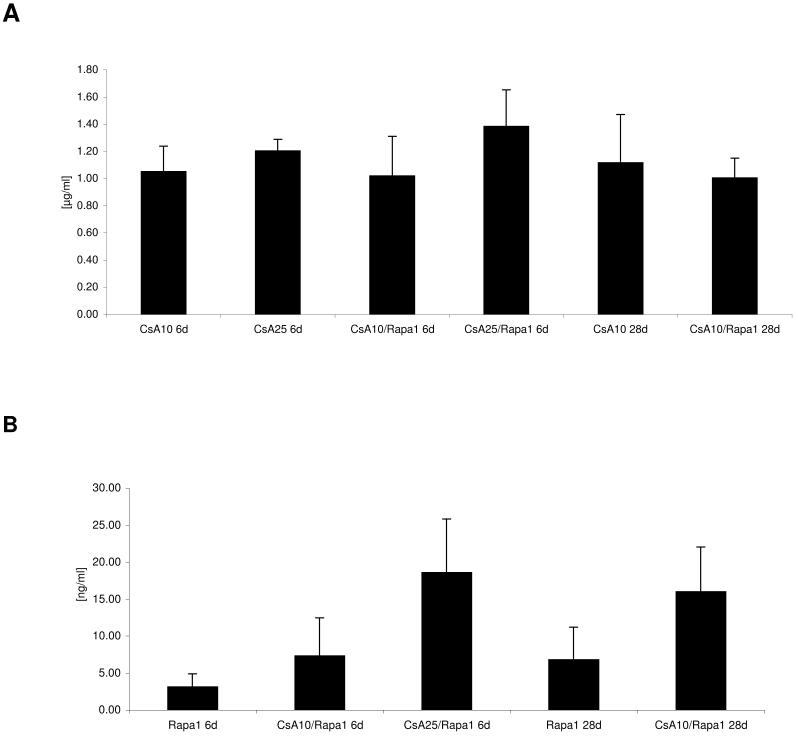
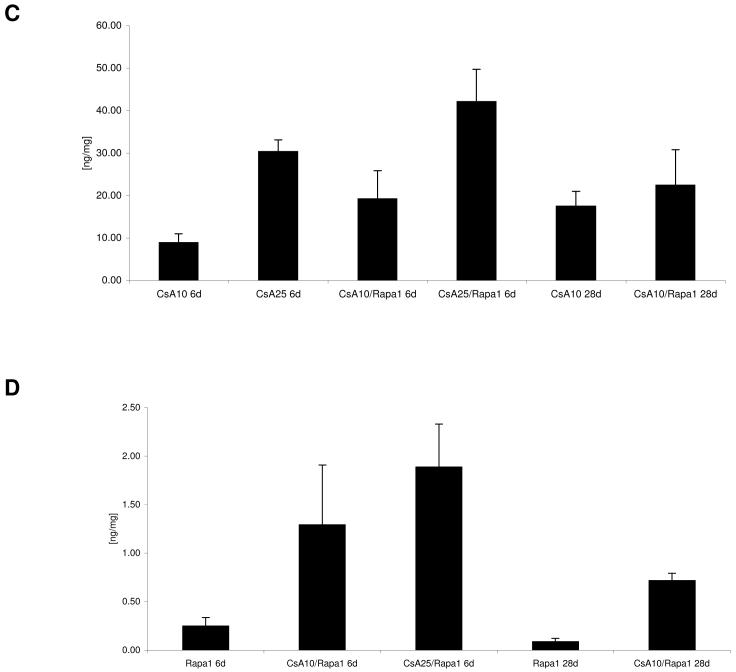
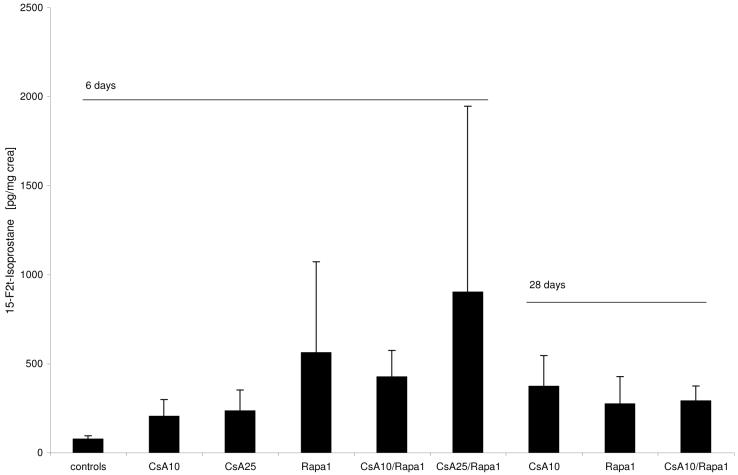
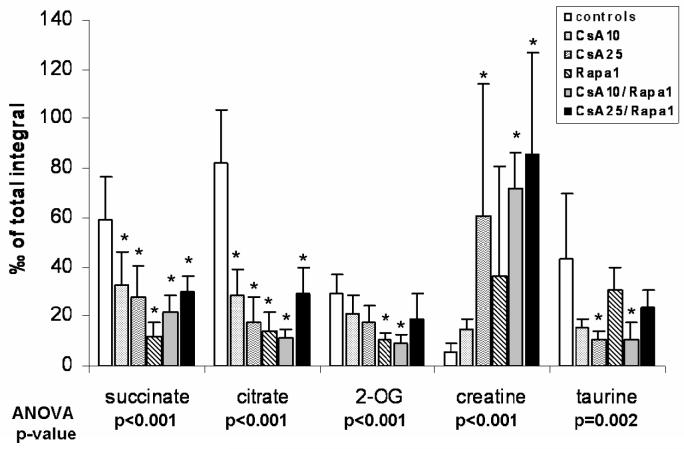
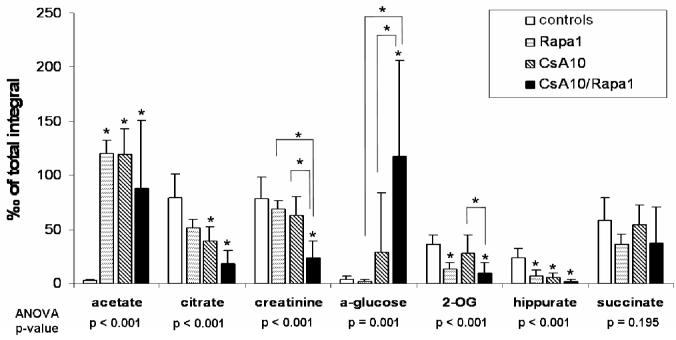
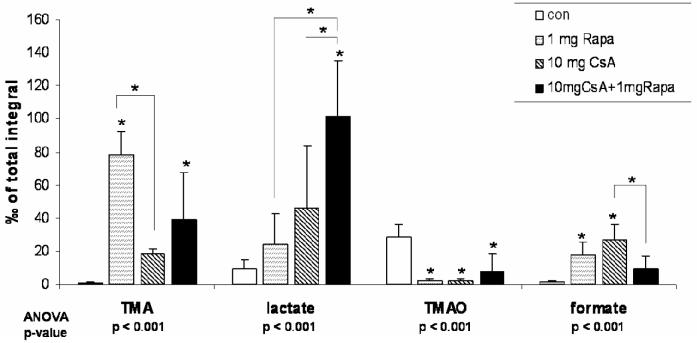
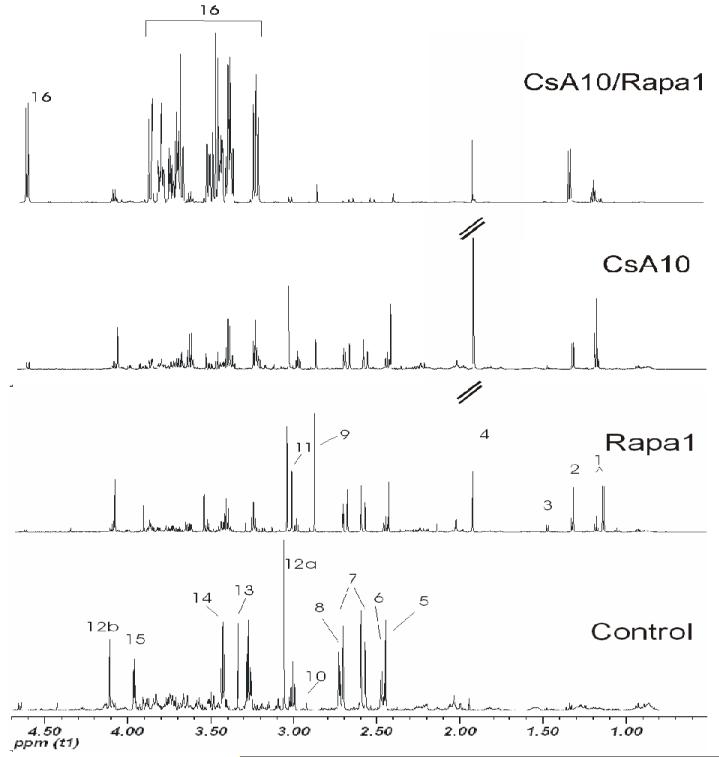
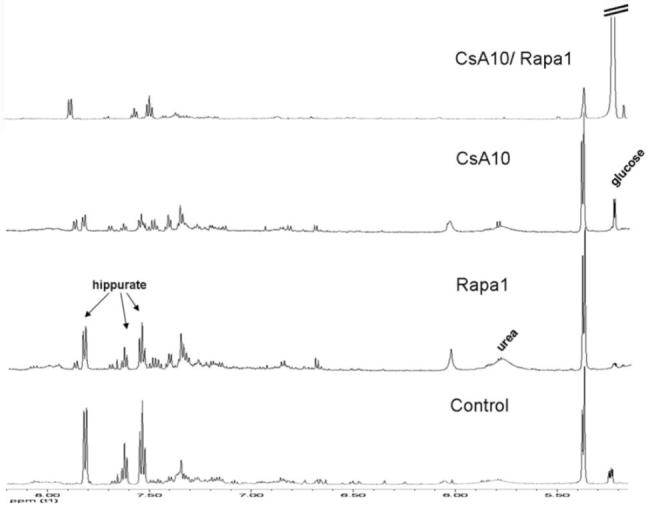
The clinical use of the immunosuppressant calcineurin inhibitor cyclosporine is limited by its nephrotoxicity. This is enhanced when combined with the immunosuppressive mTOR inhibitor sirolimus. Nephrotoxicity of both drugs is not yet fully understood. The goal was to gain more detailed mechanistic insights into the time-dependent effects of cyclosporine and sirolimus on the rat kidney by using a comprehensive approach including metabolic profiling in urine ((1)H NMR spectroscopy), kidney histology, kidney function parameters in plasma, measurement of glomerular filtration rates, the oxidative stress marker 15-F(2t)-isoprostane in urine, and immunosuppressant concentrations in blood and kidney. Male Wistar rats were treated with vehicle (controls), cyclosporine (10/25 mg/kg/day), and/or sirolimus (1 mg/kg/day) by oral gavage once daily for 6 and 28 days. Twenty-eight day treatment led to a decrease of glomerular filtration rates (cyclosporine, -59%; sirolimus, -25%). These were further decreased when both drugs were combined (-86%). Histology revealed tubular damage after treatment with cyclosporine, which was enhanced when sirolimus was added. No other part of the kidney was affected. (1)H NMR spectroscopy analysis of urine (day 6) revealed time-dependent changes of 2-oxoglutarate, citrate, and succinate concentrations. In combination with increased urine isoprostane concentrations, these changes indicated oxidative stress. After 28 days of cyclosporine treatment, urine metabonomics shifted to patterns typical for proximal tubular damage with reduction of Krebs cycle intermediates and trimethylamine-N-oxide concentrations, whereas acetate, lactate, trimethylamine, and glucose concentrations increased. Again, sirolimus enhanced these negative effects. Our results indicate that cyclosporine and/or sirolimus induce damage of the renal tubular system. This is reflected by urine metabolite patterns, which seem to be more sensitive than currently used clinical kidney function markers such as creatinine concentrations in serum. Metabolic profiling in urine may provide the basis for the development of toxicodynamic monitoring strategies for immunosuppressant nephrotoxicity.


Figures

Figure 1
Figure 1
Change in glomerular filtration rates (GFR) in the different treatment groups (all GFR values corrected for animal body weight and presented as means + standard deviations (n=6/group)), differences between groups was significant at p<0.001 (one-way ANOVA) *significant compared to untreated controls using a post-hoc pairwise multiple comparison (Holm-Sidak method). Groups: con: vehicle-treated controls, CsA10: 10 mg/kg/day cyclosporine, CsA25: 25 mg/kg/day cyclosporine, Rapa1: 1 mg/kg/day sirolimus, CsA10/Rapa1: co-administration of 10 mg/ kg/ day cyclosporine and 1 mg/kg/day sirolimus, CsA25/Rapa1: co-administration of 25 mg/kg/day cyclosporine and 1 mg/kg/day sirolimus.
Figure 2
Figure 2
Representative histology (HE stain) of kidney tissues from the different treatment groups at day 28 (total number of tissue samples evaluated: n=6/ treatment group, all histologies (A-C): magnification 10×22, (D): magnification 20×22). After 6 days of treatment, none of the groups revealed any significant histological changes in comparison to kidneys from vehicle-treated controls (A). After treatment with sirolimus (1 mg/kg/day), kidneys revealed alterations of the tubular system appearing as severe atrophy and dilation. These changes were reproducible and clearly detectable in every animal (B). Following long-term treatment with cyclosporine (10 mg/kg/day), kidneys showed a patchy alteration caused again by mild tubular atrophy (shrinking of the proximal tubular cytoplasm) plus atrophy and luminal dilation of the distal tubulus system. As another typical finding, there was a most significant presence of micro- and macrovesicular occlusion bodies in almost all tubular epithelial cells (C). These changes were similar and much more pronounced in the group receiving a combination treatment protocol of sirolimus and cyclosporine (D). Groups: con: vehicle-treated controls, CsA10: 10 mg/kg/day cyclosporine, CsA25: 25 mg/kg/day cyclosporine, Rapa1: 1 mg/kg/day sirolimus, CsA10/Rapa1: co-administration of 10 mg/ kg/ day cyclosporine and 1 mg/kg/day sirolimus, CsA25/Rapa1: co-administration of 25 mg/kg/day cyclosporine and 1 mg/kg/day sirolimus.
Figure 2
Figure 2
Representative histology (HE stain) of kidney tissues from the different treatment groups at day 28 (total number of tissue samples evaluated: n=6/ treatment group, all histologies (A-C): magnification 10×22, (D): magnification 20×22). After 6 days of treatment, none of the groups revealed any significant histological changes in comparison to kidneys from vehicle-treated controls (A). After treatment with sirolimus (1 mg/kg/day), kidneys revealed alterations of the tubular system appearing as severe atrophy and dilation. These changes were reproducible and clearly detectable in every animal (B). Following long-term treatment with cyclosporine (10 mg/kg/day), kidneys showed a patchy alteration caused again by mild tubular atrophy (shrinking of the proximal tubular cytoplasm) plus atrophy and luminal dilation of the distal tubulus system. As another typical finding, there was a most significant presence of micro- and macrovesicular occlusion bodies in almost all tubular epithelial cells (C). These changes were similar and much more pronounced in the group receiving a combination treatment protocol of sirolimus and cyclosporine (D). Groups: con: vehicle-treated controls, CsA10: 10 mg/kg/day cyclosporine, CsA25: 25 mg/kg/day cyclosporine, Rapa1: 1 mg/kg/day sirolimus, CsA10/Rapa1: co-administration of 10 mg/ kg/ day cyclosporine and 1 mg/kg/day sirolimus, CsA25/Rapa1: co-administration of 25 mg/kg/day cyclosporine and 1 mg/kg/day sirolimus.
Figure 3
Figure 3. Blood and kidney tissue concentrations of cyclosporine and sirolimus 4 hours after the last dose
A) cyclosporine blood concentrations 4 hours after the last dose (all concentrations are presented as means + standard deviations (p=0.031); B) sirolimus blood concentrations 4 hours after the last dose (p<0.001); C) cyclosporine kidney tissue concentrations (p<0.001); D) sirolimus kidney tissue concentrations (p<0.001), all groups n=6, group comparison by one-way ANOVA Groups: con: vehicle-treated controls, CsA10: 10 mg/kg/day cyclosporine, CsA25: 25 mg/kg/day cyclosporine, Rapa1: 1 mg/kg/day sirolimus, CsA10/Rapa1: co-administration of 10 mg/ kg/ day cyclosporine and 1 mg/kg/day sirolimus, CsA25/Rapa1: co-administration of 25 mg/kg/day cyclosporine and 1 mg/kg/day sirolimus.
Figure 4
Figure 4. 15-F2t-Isoprostane concentrations in urine after 6 and 28 days of treatment
All concentrations were normalized to urine creatinine concentration to compensate for differences in urine concentrations and are shown as means + standard deviations (n=6 for all groups). Group comparison (one-way ANOVA) failed to show statistically significant differences (p=0.054). Groups: con: vehicle-treated controls, CsA10: 10 mg/kg/day cyclosporine, CsA25: 25 mg/kg/day cyclosporine, Rapa1: 1 mg/kg/day sirolimus, CsA10/Rapa1: co-administration of 10 mg/ kg/ day cyclosporine and 1 mg/kg/day sirolimus, CsA25/Rapa1: co-administration of 25 mg/kg/day cyclosporine and 1 mg/kg/day sirolimus.
Figure 5
Figure 5. Changes in urine metabolite patterns after 6 days of treatment
The pattern changes observed matched those typically associated with free radical formation (58), (all urine metabolites determined semi-quantitatively by 1H-NMR, all values were normalized based on the total integral and are presented as means + standard deviations (n=6 for all groups), group comparison by one-way ANOVA, *significance levels estimated using a post-hoc pairwise multiple comparison (Holm-Sidak method). Groups: con: vehicle-treated controls, CsA10: 10 mg/kg/day cyclosporine, CsA25: 25 mg/kg/day cyclosporine, Rapa1: 1 mg/kg/day sirolimus, CsA10/Rapa1: co-administration of 10 mg/ kg/ day cyclosporine and 1 mg/kg/day sirolimus, CsA25/Rapa1: co-administration of 25 mg/kg/day cyclosporine and 1 mg/kg/day sirolimus.
Figure 6
Figure 6
Changes in urine metabolite patterns after 28 days of treatment as assessed by 1H-NMR spectroscopy- urine metabolites associated with S3 tubular damage (44), (all urine metabolites determined semi-quantitatively by 1H-NMR, all values were normalized based on the total integral and are presented as means + standard deviations (n=6 for all groups), group comparison by one-way ANOVA, *significance levels estimated using a post-hoc pairwise multiple comparison (Holm-Sidak method). Groups: con: vehicle-treated controls, CsA10: 10 mg/kg/day cyclosporine, CsA25: 25 mg/kg/day cyclosporine, Rapa1: 1 mg/kg/day sirolimus, CsA10/Rapa1: co-administration of 10 mg/ kg/ day cyclosporine and 1 mg/kg/day sirolimus, CsA25/Rapa1: co-administration of 25 mg/kg/day cyclosporine and 1 mg/kg/day sirolimus.
Figure 7
Figure 7
Changes in urine metabolite patterns after 28 days of treatment as assessed by 1H-NMR spectroscopy (all urine metabolites determined semi-quantitatively by 1H-NMR, all values were normalized based on the total integral and are presented as means + standard deviations (n=6 for all groups), group comparison by one-way ANOVA, *significance levels estimated using a post-hoc pairwise multiple comparison (Holm-Sidak method). Groups: con: vehicle-treated controls, CsA10: 10 mg/kg/day cyclosporine, CsA25: 25 mg/kg/day cyclosporine, Rapa1: 1 mg/kg/day sirolimus, CsA10/Rapa1: co-administration of 10 mg/ kg/ day cyclosporine and 1 mg/kg/day sirolimus, CsA25/Rapa1: co-administration of 25 mg/kg/day cyclosporine and 1 mg/kg/day sirolimus.
Figure 8
Figure 8. Representative 1H-NMR spectra (aliphatic region) of urine extracts after treatment for 28 days
The total number of urine samples evaluated for each group was n=6. Signal assignments: 1 drug vehicle compounds, 2 lactate, 3 alanine, 4 acetate, 5 succinate, 6 2-oxoglutarate, 7 citrate, 8 dimethylamine, 9 trimethylamine, 10 dimethyl glycine, 11 creatine, 12a/b creatinine, 13 trimethylamine oxide, 14 taurine, 15 hippurate, 16 α-glucose. Groups: con: vehicle-treated controls, CsA10: 10 mg/kg/day cyclosporine, CsA25: 25 mg/kg/day cyclosporine, Rapa1: 1 mg/kg/day sirolimus, CsA10/Rapa1: co-administration of 10 mg/ kg/ day cyclosporine and 1 mg/kg/day sirolimus, CsA25/Rapa1: co-administration of 25 mg/kg/day cyclosporine and 1 mg/kg/day sirolimus.
Figure 9
Figure 9. Representative 1H-NMR spectra (aromatic region) of urine extracts after treatment for 28 days
The total number of urine samples evaluated for each group was n=6. Glucose, urea and hippurate signals are shown. Groups: con: vehicle-treated controls, CsA10: 10 mg/kg/day cyclosporine, CsA25: 25 mg/kg/day cyclosporine, Rapa1: 1 mg/kg/day sirolimus, CsA10/Rapa1: co-administration of 10 mg/ kg/ day cyclosporine and 1 mg/kg/day sirolimus, CsA25/Rapa1: co-administration of 25 mg/kg/day cyclosporine and 1 mg/kg/day sirolimus.

Similar articles

Cited by

References

    1. Meier-Kriesche HU, Hricik DE. Are we ready to give up on calcineurin inhibitors? Am J Transplant. 2006;6:445–446. - PubMed
    1. Ojo AO, Held PJ, Port FK, Wolfe RA, Leichtman AB, Young EW, Arndorfer J, Christensen L, Merion RM. Chronic renal failure after transplantation of a nonrenal organ. N Engl J Med. 2003;349:931–940. - PubMed
    1. Shihab FS. Cyclosporine nephropathy: pathophysiology and clinical impact. Semin Nephrol. 1996;16:536–547. - PubMed
    1. Guerra G, Srinivas TR, Meier-Kriesche HU. Calcineurin inhibitor-free immunosuppression in kidney transplantation. Transpl Int. 2007;20:813–827. - PubMed
    1. Campistol JM, Grinyo JM. Exploring treatment options in renal transplantation: the problems of chronic allograft dysfunction and drug-related nephrotoxicity. Transplantation. 2001;71:SS42–51. - PubMed

Publication types

MeSH terms