. 2009 Jan;9(1):442-8.
doi: 10.1021/nl803405h.

Fluorescent silica nanoparticles with efficient urinary excretion for nanomedicine

Affiliations

Fluorescent silica nanoparticles with efficient urinary excretion for nanomedicine

Andrew A Burns et al. Nano Lett. 2009 Jan.

Abstract

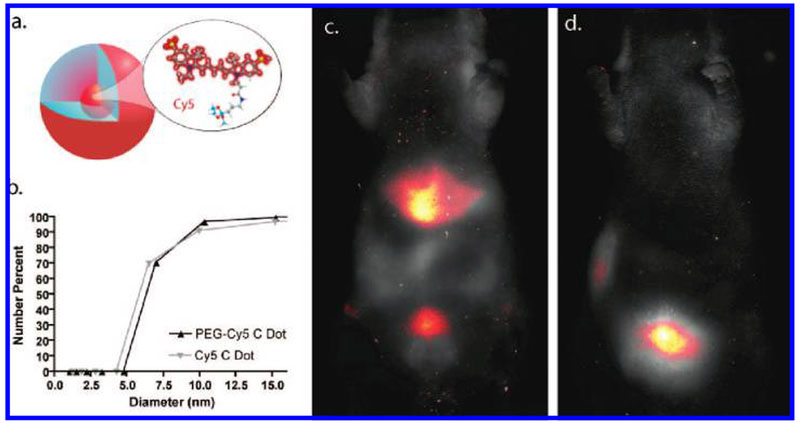
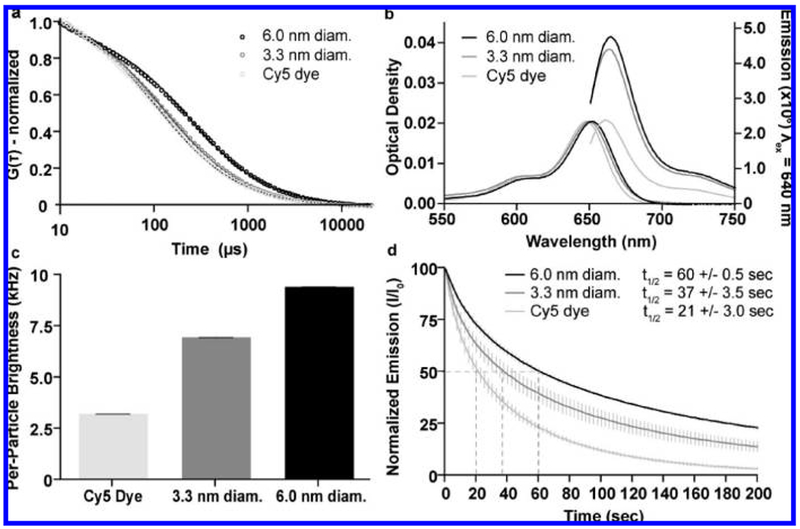
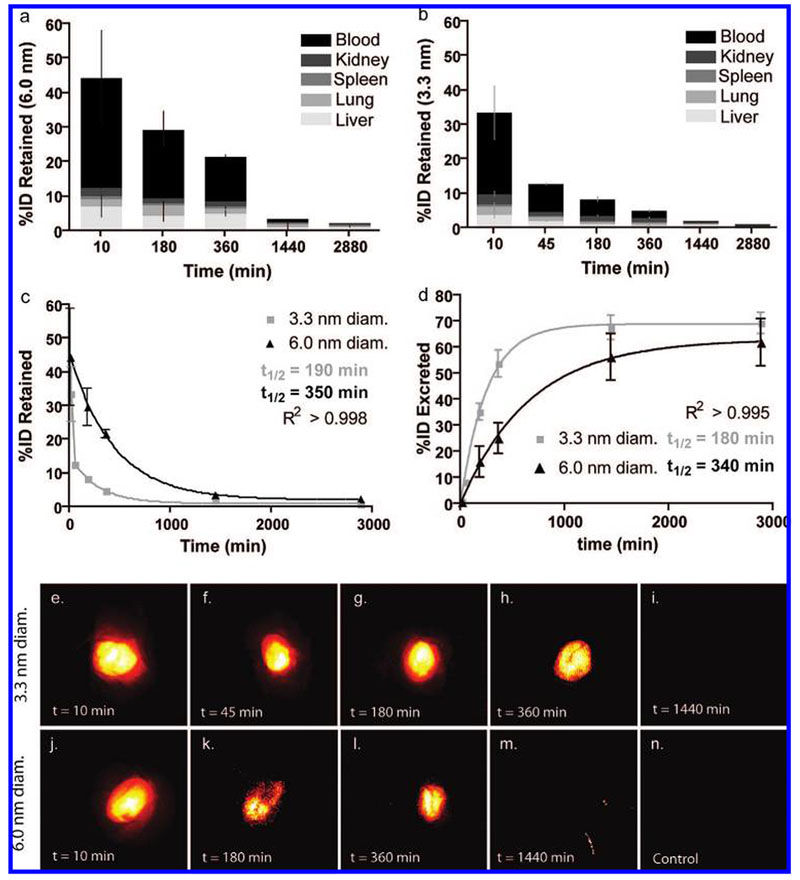
The development of molecularly targeted probes that exhibit high biostability, biocompatibility, and efficient clearance profiles is key to optimizing biodistribution and transport across biological barriers. Further, coupling probes designed to meet these criteria with high-sensitivity, quantitative imaging strategies is mandatory for ensuring early in vivo tumor detection and timely treatment response. These challenges have often only been examined individually, impeding the clinical translation of fluorescent probes. By simultaneously optimizing these design criteria, we created a new generation of near-infrared fluorescent core-shell silica-based nanoparticles (C dots) tuned to hydrodynamic diameters of 3.3 and 6.0 nm with improved photophysical characteristics over the parent dye. A neutral organic coating prevented adsorption of serum proteins and facilitated efficient urinary excretion. Detailed particle biodistribution studies were performed using more quantitative ex vivo fluorescence detection protocols and combined optical-PET imaging. The results suggest that this new generation of C dots constitutes a promising clinically translatable materials platform which may be adapted for tumor targeting and treatment.


Figures

Figure 1.
Figure 1.
C dot schematic and in vivo imaging (a) A schematic representation of Cy5 reactive dye incorporated into the core of an amorphous silica nanoparticle. (b) DLS (number average) plot of particle size for bare silica (gray) and PEG-coated (black) Cy5-containing silica nanoparticles (C dots). (c) In vivo imaging of spectrally demixed Cy5 particle fluorescence (pseudocolor) overlaid on visible light imaging of nude mice 45 min postinjection with bare silica C dots, showing particle accumulation in the liver and bladder. (d) In vivo imaging of spectrally demixed Cy5 particle fluorescence (pseudocolor) overlaid on visible light imaging of nude mice 45 min postinjection with PEG-ylated Cy5 C dots showing particle accumulation in the bladder.
Figure 2.
Figure 2.
Photophysical characterization. (a) FCS data and single exponential fits for Cy5 dye (light gray), 3.3 ± 0.06 nm diameter (dark gray, mean ± standard deviation n = 9) and 6.0 ± 0.1 nm diameter (black, mean ± standard deviation, n = 6) Cy5-containing PEG-coated C dots showing the differences in diffusion time resulting from the different hydrodynamic sizes of the different species. Particle sizes are significantly larger than dye for both 3.3 and 6.0 nm diameter (one-tail Mann–Whitney U test, p = 6.1 × 10⁻⁷). (b) Absorption and emission spectra of Cy5 dye (light gray), 3.3 nm diameter (dark gray) and 6.0 nm diameter (black) PEG-coated C dots, comparing the peak photoemission of the three species at equal peak absorption optical density to demonstrate the enhanced performance of the dye following the encapsulation reaction. (c) Relative brightness comparison of free dye (light gray) with 3.3 nm (dark gray) and 6.0 nm diameter (black) C dots, measured as count rate per molecule/particle as determined from the FCS curves, demonstrating the enhancement effects over free dye that increase with particle size (mean ± standard deviation, n = 15) Both 3.3 and 6.0 nm diameter particles exhibit significant increases in count rate/particle compared to free dye (one-tail Mann–Whitney U test, p = 1.53 × 10⁻⁶, 1.53 × 10⁻⁶). (d) Photobleaching data for Cy5 dye (light gray), 3.3 nm diameter (dark gray), and 6.0 nm diameter (black) PEG-coated C dots under ~3.5 mW laser excitation, demonstrating the enhanced photostability of the dye following silica encapsulation (mean ± standard deviation, n = 5). The time at which 50% of the photoemission is reduced (t1/2) is indicated for each of the different species. Both 3.3 and 6.0 nm diameter particles exhibit significant increases in photobleaching half-life with respect to free dye (one tail Mann–Whitney U test, p = 0.0104, 0.0104, respectively).
Figure 3.
Figure 3.
Particle retention and excretion and near-infrared fluorescence imaging. (a, b) Percent of initial particle dose (%ID) retained by blood (black) and tissues: liver (light gray), lung (mid-low gray), spleen (midgray), and kidney (mid-high gray) for 6.0 nm (a) and 3.3 nm (b) diameter C dots at various time points from 10 min to 48 h postinjection (n = 3 mice, mean ± standard deviation). (c) Plot of retained particle concentration for 3.3 nm (light gray) and 6.0 nm (black) diameter C dots and the associated logarithmic decay fits and half-lives. (d) Plot of estimated particle excretion for 3.3 nm (light gray) and 6.0 nm (black) diameter dots and the associated logarithmic fits and half-lives (mean ± standard deviation, n = 9 (three mice, three technical replicates per time point)). (e–i) Pseudocolor images of Cy5 fluorescence (demixed) in intact mouse bladders showing the accumulation of 3.3 nm diameter dots over the course of the first 6 h postinjection (e–h), followed by the negligible particle fluorescence seen at 24 h postinjection (i).(j–m) Pseudocolor images of Cy5 fluorescence (demixed) in intact mouse bladders showing the accumulation of 6.0 nm diameter dots in the first 6 h postinjection (j–l) and at the 24 h end point (m). (n) Pseudocolor image of a control mouse bladder. Further fluorescence and anatomical brightfield images can be found in the Supporting Information, Figures 2 and 3.

References

    1. Hood L; Heath J; Phelps M; Lin B Science 2004, 306, 640–643. - PubMed
    1. Frangioni JV Curr. Opin. Chem. Biol 2003, 7 (5), 626–634. - PubMed
    1. Sevick-Muraca E; Houston J; Gurfinkel M Curr. Opin. Chem. Biol 2002, 6, 642–650. - PubMed
    1. Wagner V; Dullaart A; Bock A-K; Zweck A Nat. Biotechnol 2006, 24 (10), 1211–1217. - PubMed
    1. Ohnishi S; Lomnes S; Laurence R; Gogbashian A; Mariani G; Frangioni J Mol. Imaging 2005, 4 (3), 172–181. - PubMed

Publication types