. 2008;9(12):R182.
doi: 10.1186/gb-2008-9-12-r182. Epub 2008 Dec 19.

A genome-wide screen for modifiers of transgene variegation identifies genes with critical roles in development

Affiliations

A genome-wide screen for modifiers of transgene variegation identifies genes with critical roles in development

Alyson Ashe et al. Genome Biol. 2008.

Abstract

Background: Some years ago we established an N-ethyl-N-nitrosourea screen for modifiers of transgene variegation in the mouse and a preliminary description of the first six mutant lines, named MommeD1-D6, has been published. We have reported the underlying genes in three cases: MommeD1 is a mutation in SMC hinge domain containing 1 (Smchd1), a novel modifier of epigenetic gene silencing; MommeD2 is a mutation in DNA methyltransferase 1 (Dnmt1); and MommeD4 is a mutation in Smarca 5 (Snf2h), a known chromatin remodeler. The identification of Dnmt1 and Smarca5 attest to the effectiveness of the screen design.

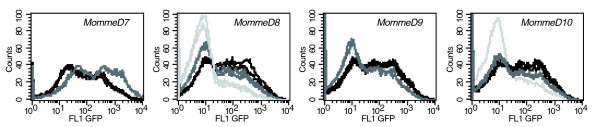
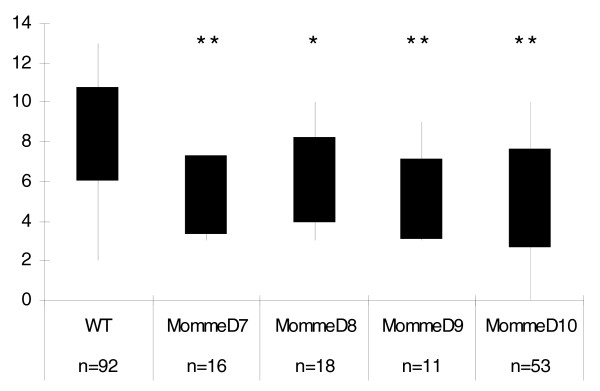
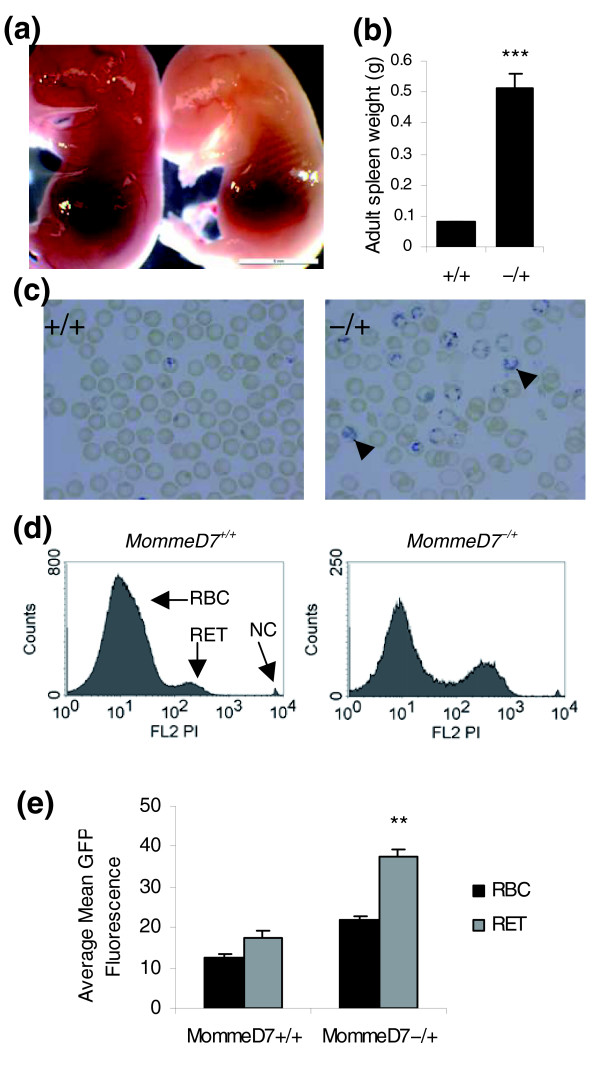
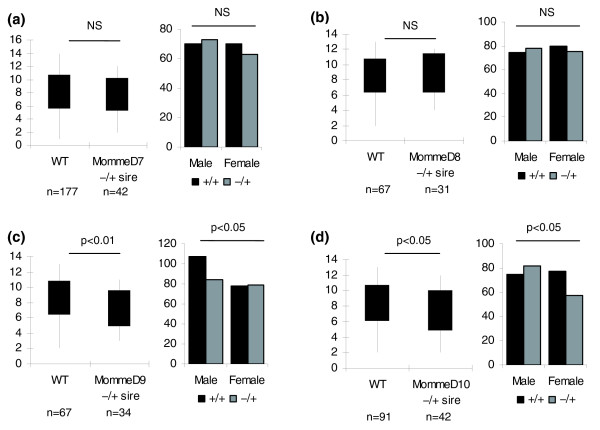
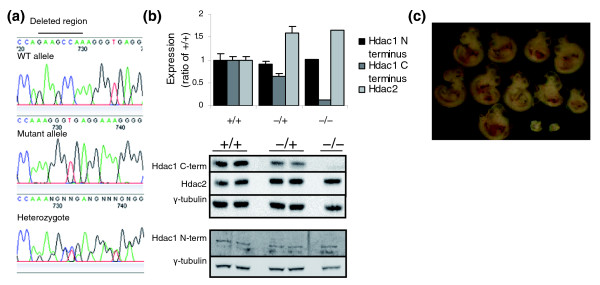
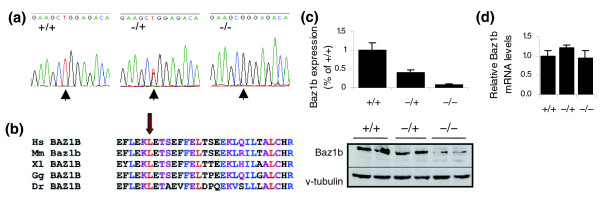
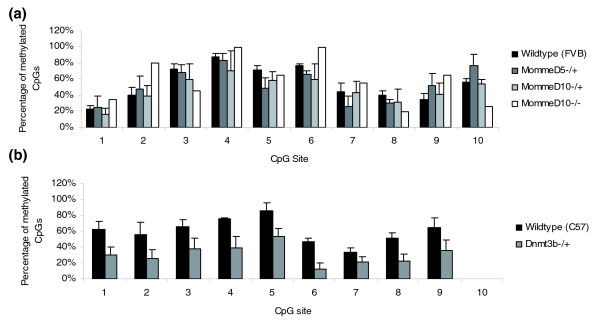
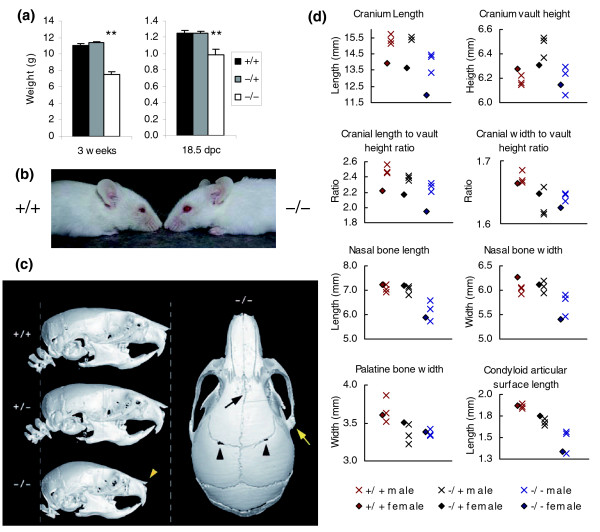
Results: We have now extended the screen and have identified four new modifiers, MommeD7-D10. Here we show that all ten MommeDs link to unique sites in the genome, that homozygosity for the mutations is associated with severe developmental abnormalities and that heterozygosity results in phenotypic abnormalities and reduced reproductive fitness in some cases. In addition, we have now identified the underlying genes for MommeD5 and MommeD10. MommeD5 is a mutation in Hdac1, which encodes histone deacetylase 1, and MommeD10 is a mutation in Baz1b (also known as Williams syndrome transcription factor), which encodes a transcription factor containing a PHD-type zinc finger and a bromodomain. We show that reduction in the level of Baz1b in the mouse results in craniofacial features reminiscent of Williams syndrome.

Conclusions: These results demonstrate the importance of dosage-dependent epigenetic reprogramming in the development of the embryo and the power of the screen to provide mouse models to study this process.


Figures

Figure 1
Figure 1
GFP expression profiles in MommeD7-D10. Erythrocytes from 3-week-old mice were analyzed by flow cytometry. In each case, the expression profiles from one litter of a heterozygous intercross are displayed. The phenotypically wild-type mice are shown in black, heterozygotes in dark grey, and homozygotes (MommeD8 and D10 only) in light grey. The x-axis represents the erythrocyte fluorescence on a logarithmic scale, and the y-axis is the number of cells detected at each fluorescence level. For quantitative and statistical significance, see Table 1.
Figure 2
Figure 2
Litter size at weaning following heterozygous intercrosses. Litter size at weaning in all of MommeD7-D10 is significantly lower than that found in a wild-type (WT) cross. n represents the number of litters. *p < 0.05; **p < 0.001.
Figure 3
Figure 3
Hematopoietic abnormalities in MommeD7 mice. (a) Examples of phenotypically normal and abnormal (pale) embryos at 17.5 dpc. Abnormal embryos are assumed to be homozygous for MommeD7. Scale bar = 5 mm. (b) Spleen weights from MommeD7+/+ and MommeD7-/+ adult mice. Error bars represent SEM. ***p < 0.0001. (c) Blood smears from MommeD7+/+ (left) and MommeD7-/+ (right) mice stained for reticulocytes (shown with arrowheads). (d) Representative histograms showing propidium iodide fluorescence in MommeD7+/+ (left) and MommeD7-/+ (right) mice. In each case 10,000 reticulocytes were counted. Red blood cells (RBC), reticulocytes (RET) and nucleated cells (NC) are shown. (e) Histogram showing relative levels of GFP fluorescence in red blood cells and reticulocytes. Averages were calculated from three wild-type and three heterozygous mice. **p < 0.005; error bars represent SEM.
Figure 4
Figure 4
Genotypes and sex of offspring, and litter size following paternal transmission of MommeD7-D10. (a) MommeD7, (b) MommeD8, (c) MommeD9, and (d) MommeD10 show the numbers of male and female offspring of wild-type (WT; black) and heterozygous (grey) genotype produced following a cross between a male heterozygous Momme and a wild-type female. MommeD9 and MommeD10 both show a trend towards transmission ratio distortion and a significant reduction in litter size compared to wild-type crosses. n represents the number of litters produced.
Figure 5
Figure 5
A mutation in Hdac1 correlates with the MommeD5-/- phenotype. (a) A 7 bp deletion was detected in exon 13 of Hdac1. Representative chromatograms from the wild-type (WT) allele, the mutant allele, and one heterozygote are shown. This deletion alters the reading frame, changing the last 12 amino acids and adding 25 extra amino acids. (b) Whole-cell lysates from six individual 10.5 dpc MommeD5+/+ and MommeD5-/+ embryos, and six pooled MommeD5-/- embryos were probed with antibodies to the Hdac1 carboxyl terminus (top panel), Hdac2 (top panel) and Hdac1 amino terminus (bottom panel). Anti-γ-tubulin was used as a loading control in each case. Quantification of the Hdac1 carboxyl terminus relative to γ-tubulin shows negligible binding in MommeD5-/- mice. Quantification of Hdac2 levels relative to γ-tubulin shows increased Hdac2 in MommeD5-/+ and MommeD5-/- embryos. Quantification of Hdac1 amino terminus relative to γ-tubulin shows equal levels of Hdac1 in all mice. A peptide blocking experiment was performed to confirm band identity. A representative western blot is shown. Error bars represent SEM. (c) A representative litter from a MommeD5-/+ intercross at 10.5 dpc. MommeD5-/- embryos (bottom right) are always dramatically smaller than MommeD5+/+ and MommeD5-/+ littermates.
Figure 6
Figure 6
A point mutation in Baz1b correlates with the MommeD10-/- phenotype. (a) A single base-pair mutation was detected in exon 7 of Baz1b. Representative chromatograms from one wild type, one heterozygote and one homozygote are shown. This results in a non-conservative amino acid change, L733R. (b) The MommeD10 point mutation (arrow) modifies an amino acid highly conserved across species (Hs, Homo sapiens; Mm, Mus musculus; Xl, Xenopus laevis; Gg, Gallus gallus; Dr, Danio rerio). (c) Whole-cell lysates from four 14.5 dpc heads of each genotype were probed with anti-Baz1b. Anti-γ-tubulin was used as a loading control. Quantification of Baz1b relative to γ-tubulin shows negligible levels of Baz1b in MommeD10-/- mice. A representative western blot is shown. (d) Expression analysis by quantitative real-time RT-PCR was performed on mRNA prepared from 14.5 dpc heads. Levels of Baz1b mRNA were not affected by the mutation. Analysis was performed on three individuals of each genotype and normalized to two house-keeping genes. Error bars in all graphs represent SEM.
Figure 7
Figure 7
Bisulfite analysis of the HS-40 enhancer element. (a) DNA was extracted from the spleen of 4-week-old wild-type (FVB/NJ; three mice), MommeD5-/+ (three mice), MommeD10-/+ (three mice) mice and from the tail of MommeD10-/- mice (two mice). After bisulfite sequencing, the percentage of CpG methylation at each CpG site in the cloned region was analyzed, and averaged across individuals of the same genotype. None are significantly different from the wild-type mouse. Error bars represent SEM. (b) DNA was extracted from the tail of 4-week-old wild-type (C57BL/6; four mice) and Dnmt3b+/- (four mice) mice. After bisulfite sequencing, the percentage of CpG methylation at each CpG site in the cloned region was analyzed, and averaged across individuals of the same genotype. The Dnmt3b+/- mice have significantly (p < 0.001) less methylation than the wild-type mice. Error bars represent SEM.
Figure 8
Figure 8
MommeD10-/- mice are smaller than their littermates and display craniofacial abnormalities. (a) Body weight was measured for 46 MommeD10+/+, 102 MommeD10-/+ and 10 MommeD10-/- weaners (3 weeks), and 11 MommeD10+/+, 22 MommeD10-/+ and 5 MommeD10-/- embryos (18.5 dpc). Histograms show mean and SEM. (b) Craniofacial abnormalities in adult MommeD10-/- mice. MommeD10-/- mice display shorter snouts than age and sex-matched wild-type littermates. (c) Three-dimensional reconstruction of skull microCT data from 4-week-old male mice reveals distinct anomalies in homozygous Baz1B mice. Left side: lateral views show the overall size and shape of heterozygous skulls is similar to that of wild-type skulls, whereas skulls of homozygotes were around 20% shorter. Homozygous skulls showed variable anomalies, but consistently had a bulbous appearance, and a short, flattened, or upwardly angulated nasal bone (yellow arrowhead). Slight angulation of the nasal bones was also noted in one heterozygote. Right side: dorsal view of the homozygote skull shown on the left side showing the abnormal shape and more rostral connection of the zygomatic process with the squamosal bone (yellow arrow), skewing of the midline frontal bone suture (black arrow) and minor bilateral anomalies of the frontal:parietal suture (black arrowheads). (d) Twenty cranial landmarks and nine mandibular landmarks (based on those of Richtsmeier [49]) were located on each of nine skulls and inter-landmark measurements recorded. The mean value of each measurement, including analysis of cranium height:width and cranium length:height ratios, was compared between homozygous, heterozygous and wild-type animals.
Figure 9
Figure 9
Whole mount in situ hybridization analysis in mouse embryos shows expression in the developing facial prominences. Embryos at a range of mid-gestational stages were hybridized with an antisense ribroprobe to the 3' untranslated region of Baz1b. (a-e) Views of whole embryos from 8.25-11.5 dpc reveal strong expression in the mesenchyme of the maxillary and mandibular prominences, branchial arch 2 and the nasal processes. Other sites of Baz1b expression include the presumptive hindbrain, headfolds and tailbud at 8.5 dpc, and the limb mesenchyme and somites at later stages. (f) Higher magnification dorsal view of presumptive hindbrain staining at 8.25 dpc. Close up images of facial prominence staining are shown at (g) 8.75 dpc, (h) 10.5 dpc, and (i) 11.5 dpc. Images shown in (h, i) are ventral views following dissection of the head from the body of the embryo. BA1, branchial arch 1; BA2, branchial arch 2; Fl, forelimb; Fnp, frontonasal process; Hb, hindbrain; Hf, headfold; Hl, hindlimb; Lnp, lateral nasal prominence; Md, mandibular prominence; Mnp, medial nasal prominence; Mx, maxillary prominence; R, rhombomere; S, somite; Tb, tailbud.

References

    1. Henikoff S. Position-effect variegation after 60 years. Trends Genet. 1990;6:422–426. doi: 10.1016/0168-9525(90)90304-O. - DOI - PubMed
    1. Spofford JB. Parental control of position-effect variegation. II. Effect of sex of parent contributing white-mottled rearrangement in Drosophila melanogaster. Genetics. 1961;46:1151–1167. - PMC - PubMed
    1. Wolff GL. Influence of maternal phenotype on metabolic differentiation of agouti locus mutants in the mouse. Genetics. 1978;88:529–539. - PMC - PubMed
    1. Rakyan VK, Blewitt ME, Druker R, Preis JI, Whitelaw E. Metastable epialleles in mammals. Trends Genet. 2002;18:348–351. doi: 10.1016/S0168-9525(02)02709-9. - DOI - PubMed
    1. Waterland RA, Jirtle RL. Transposable elements: targets for early nutritional effects on epigenetic gene regulation. Mol Cell Biol. 2003;23:5293–5300. doi: 10.1128/MCB.23.15.5293-5300.2003. - DOI - PMC - PubMed

Publication types

LinkOut - more resources