Dimethyl sulfoxide (DMSO) produces widespread apoptosis in the developing central nervous system
- PMID: 19100327
- PMCID: PMC2682536
- DOI: 10.1016/j.nbd.2008.11.006
Dimethyl sulfoxide (DMSO) produces widespread apoptosis in the developing central nervous system
Abstract
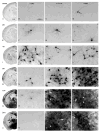
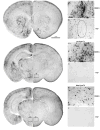
Dimethyl sulfoxide (DMSO) is a solvent that is routinely used as a cryopreservative in allogous bone marrow and organ transplantation. We exposed C57Bl/6 mice of varying postnatal ages (P0-P30) to DMSO in order to study whether DMSO could produce apoptotic degeneration in the developing CNS. DMSO produced widespread apoptosis in the developing mouse brain at all ages tested. Damage was greatest at P7. Significant elevations above the background rate of apoptosis occurred at the lowest dose tested, 0.3 ml/kg. In an in vitro rat hippocampal culture preparation, DMSO produced neuronal loss at concentrations of 0.5% and 1.0%. The ability of DMSO to damage neurons in dissociated cultures indicates that the toxicity likely results from a direct cellular effect. Because children, who undergo bone marrow transplantation, are routinely exposed to DMSO at doses higher than 0.3 ml/kg, there is concern that DMSO might be producing similar damage in human children.
Figures


Similar articles
-
Propylene glycol produces excessive apoptosis in the developing mouse brain, alone and in combination with phenobarbital.Pediatr Res. 2012 Jan;71(1):54-62. doi: 10.1038/pr.2011.12. Pediatr Res. 2012. PMID: 22289851 Free PMC article.
-
Effects of dimethyl sulfoxide on the morphology and viability of primary cultured neurons and astrocytes.Brain Res Bull. 2017 Jan;128:34-39. doi: 10.1016/j.brainresbull.2016.11.004. Epub 2016 Nov 9. Brain Res Bull. 2017. PMID: 27836802
-
Unexpected low-dose toxicity of the universal solvent DMSO.FASEB J. 2014 Mar;28(3):1317-30. doi: 10.1096/fj.13-235440. Epub 2013 Dec 10. FASEB J. 2014. PMID: 24327606
-
Neuroprotective Action of the CB1/2 Receptor Agonist, WIN 55,212-2, against DMSO but Not Phenobarbital-Induced Neurotoxicity in Immature Rats.Neurotox Res. 2019 Jan;35(1):173-182. doi: 10.1007/s12640-018-9944-9. Epub 2018 Aug 24. Neurotox Res. 2019. PMID: 30141144 Free PMC article.
-
Cytotoxic effects of dimethyl sulphoxide (DMSO) on cochlear organotypic cultures.Hear Res. 2008 Feb;236(1-2):52-60. doi: 10.1016/j.heares.2007.12.002. Epub 2007 Dec 15. Hear Res. 2008. PMID: 18207679 Free PMC article.
Cited by
-
Loss of motoneurons in the ventral compartment of the rat hypoglossal nucleus following early postnatal exposure to alcohol.J Chem Neuroanat. 2013 Sep;52:87-94. doi: 10.1016/j.jchemneu.2013.07.003. Epub 2013 Aug 8. J Chem Neuroanat. 2013. PMID: 23932955 Free PMC article.
-
A high concentration of DMSO activates caspase-1 by increasing the cell membrane permeability of potassium.Cytotechnology. 2018 Feb;70(1):313-320. doi: 10.1007/s10616-017-0145-9. Epub 2017 Sep 30. Cytotechnology. 2018. PMID: 28965287 Free PMC article.
-
Low concentrations of the solvent dimethyl sulphoxide alter intrinsic excitability properties of cortical and hippocampal pyramidal cells.PLoS One. 2014 Mar 19;9(3):e92557. doi: 10.1371/journal.pone.0092557. eCollection 2014. PLoS One. 2014. PMID: 24647720 Free PMC article.
-
Mouse oocyte vitrification with and without dimethyl sulfoxide: influence on cryo-survival, development, and maternal imprinted gene expression.J Assist Reprod Genet. 2021 Aug;38(8):2129-2138. doi: 10.1007/s10815-021-02221-1. Epub 2021 May 22. J Assist Reprod Genet. 2021. PMID: 34021463 Free PMC article.
-
Modulation of the endoplasmic reticulum stress and unfolded protein response mitigates the behavioral effects of early-life stress.Pharmacol Rep. 2023 Apr;75(2):293-319. doi: 10.1007/s43440-023-00456-6. Epub 2023 Feb 27. Pharmacol Rep. 2023. PMID: 36843201 Free PMC article.
References
-
- Aita K, Irie H, Tanuma Y, Toida S, Okuma Y, Mori S, Shiga J. Apoptosis in murine lymphoid organs following intraperitoneal administration of dimethyl sulfoxide (DMSO) Exp Mol Pathol. 2005;79:265–71. - PubMed
-
- Authier N, Dupuis E, Kwasiborski A, Eschalier A, Coudore F. Behavioural assessment of dimethylsulfoxide neurotoxicity in rats. Toxicol Lett. 2002;132:117–21. - PubMed
-
- Cattano D, Young C, Straiko MM, Olney JW. Subanesthetic doses of propofol induce neuroapoptosis in the infant mouse brain. Anesth Analg. 2008;106:1712–4. - PubMed
-
- Chateau MT, Ginestier-Verne C, Chiesa J, Caravano R, Bureau JP. Dimethyl sulfoxide-induced apoptosis in human leukemic U937 cells. Anal Cell Pathol. 1996;10:75–84. - PubMed
Publication types
MeSH terms
Substances
Grants and funding
LinkOut - more resources
Full Text Sources
Other Literature Sources

