. 2008 Dec 19;29(6):971-85.
doi: 10.1016/j.immuni.2008.10.015.

CD44 mediates successful interstitial navigation by killer T cells and enables efficient antitumor immunity

Affiliations

CD44 mediates successful interstitial navigation by killer T cells and enables efficient antitumor immunity

Paulus Mrass et al. Immunity. .

Abstract

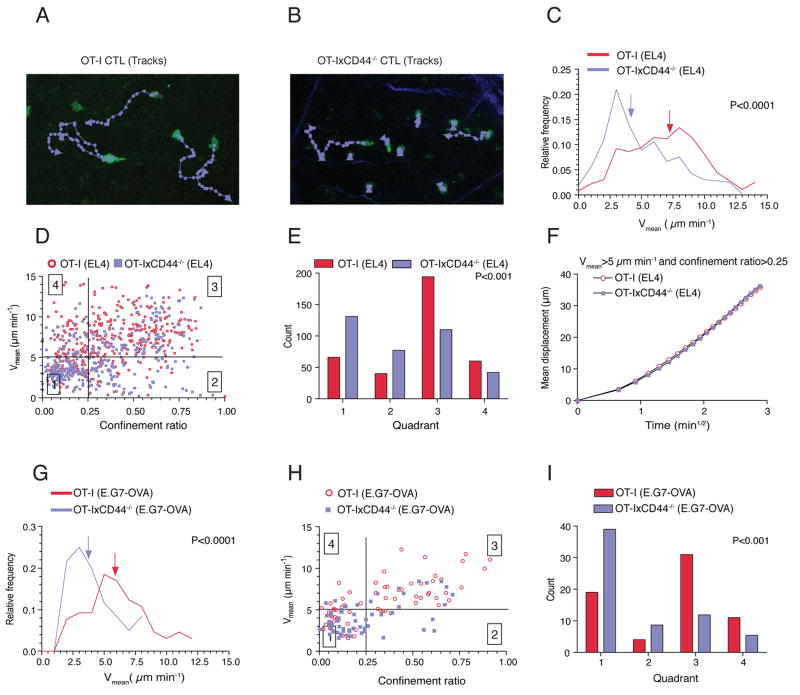
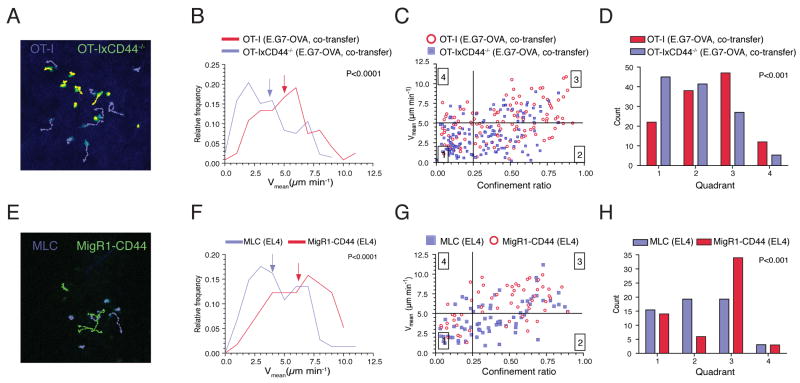
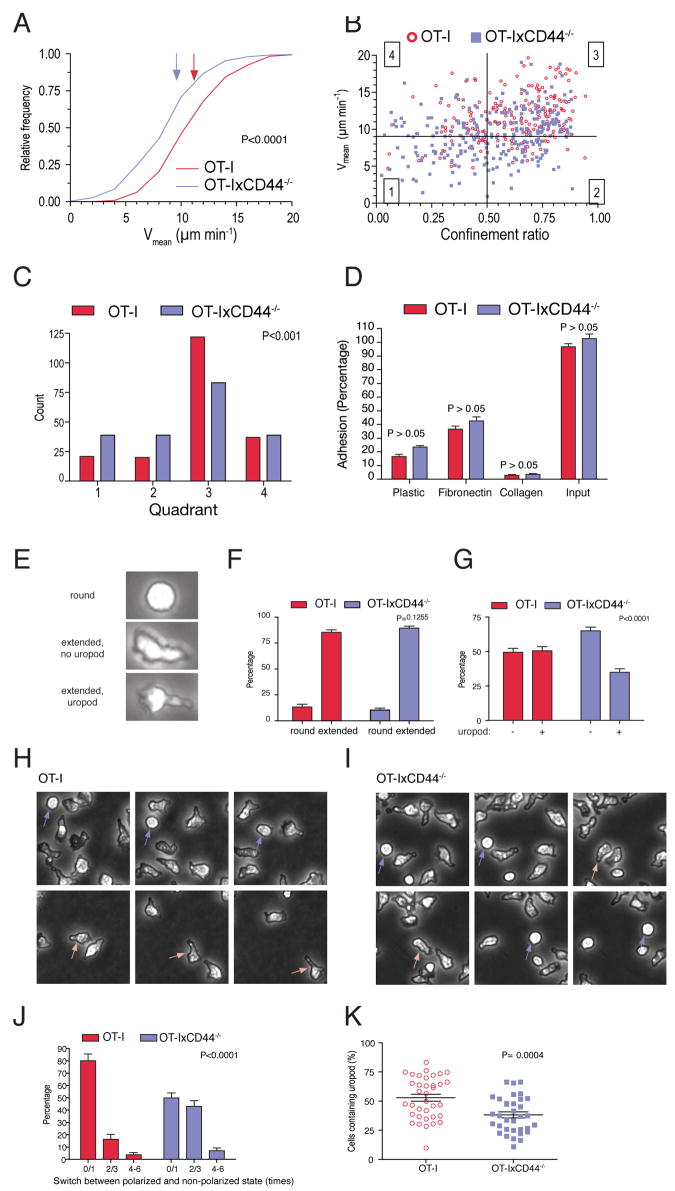
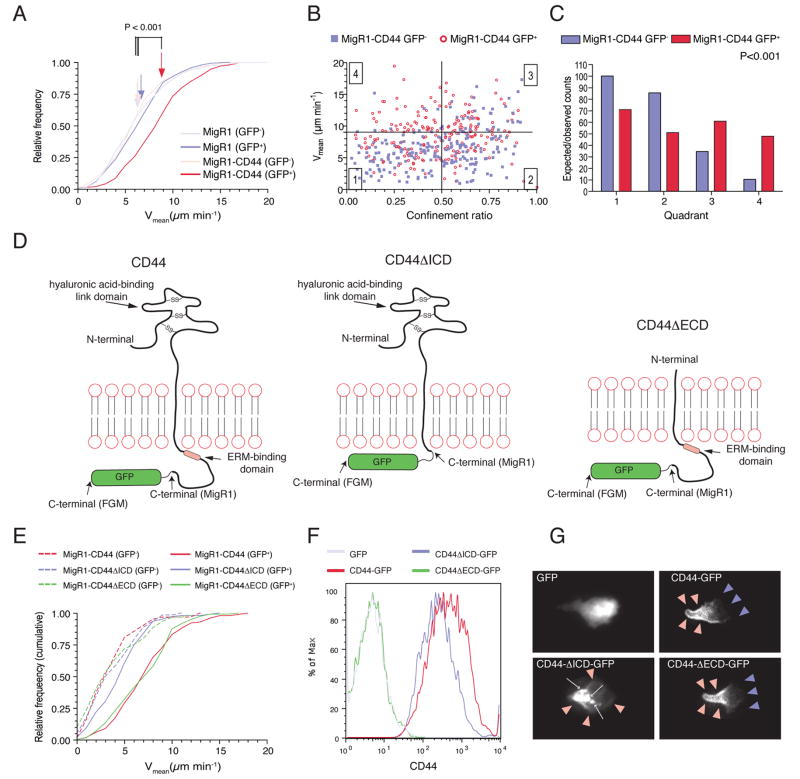
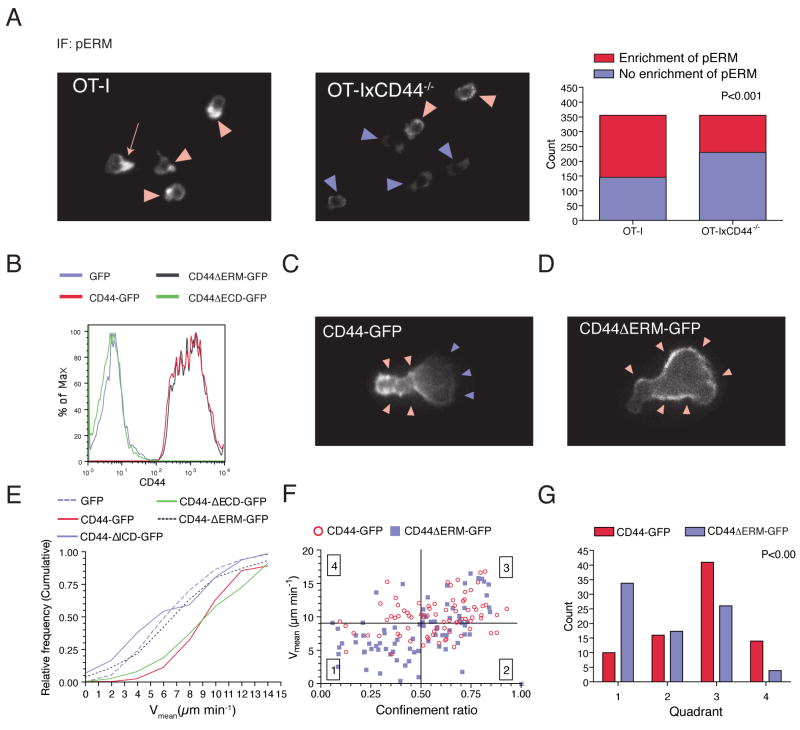
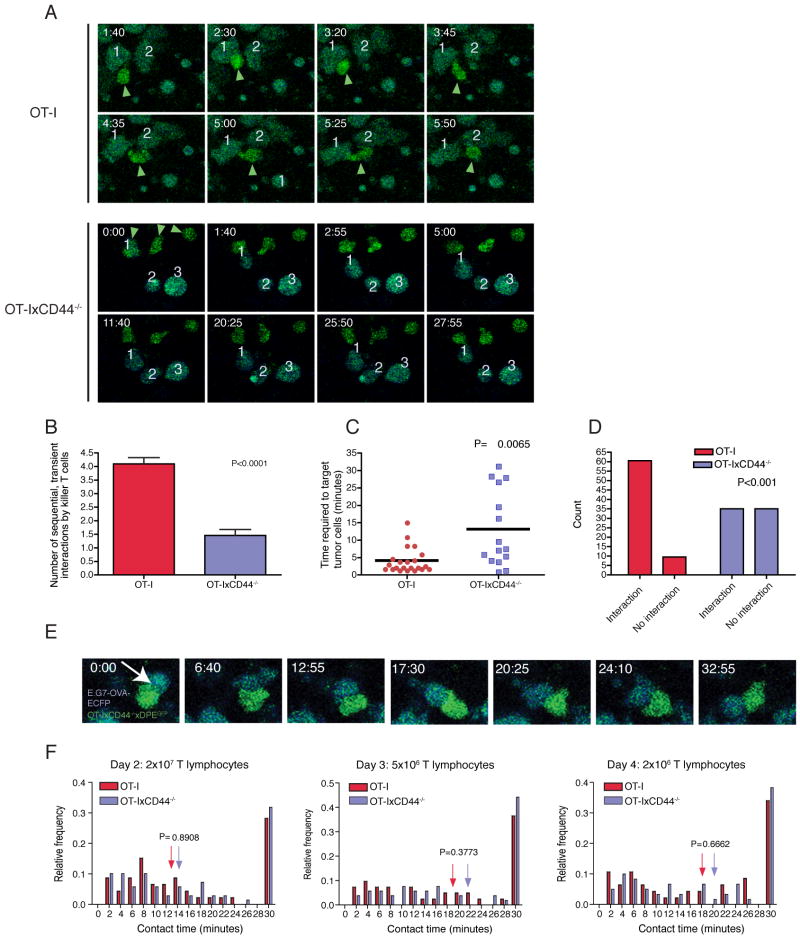
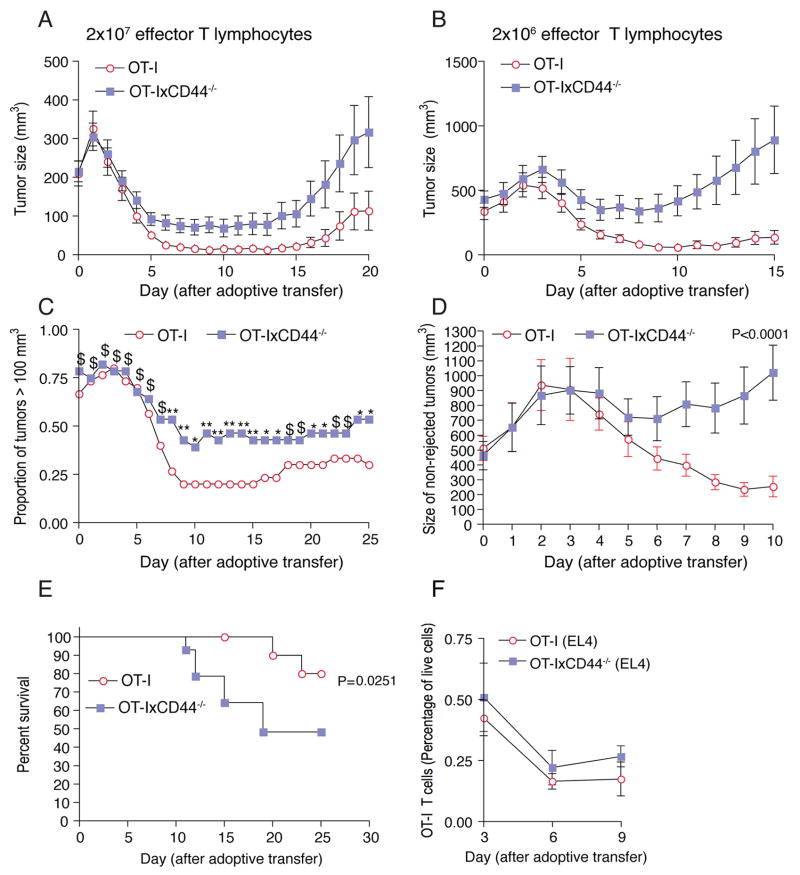
Although T lymphocytes are constitutively nonadherent cells, they undergo facultative polarity during migration and upon interaction with cells presenting cognate antigen, suggesting that cell polarity might be critical for target cell destruction. Using two-photon imaging of tumor-infiltrating T lymphocytes, we found that CD44, a receptor for extracellular matrix proteins and glycosaminoglycans, was crucial for interstitial T cell navigation and, consequently, efficient tumor cell screening. CD44 functioned as a critical regulator of intratumoral movement by stabilizing cell polarity in migrating T cells, but not during target cell interactions. Stable anterior-posterior asymmetry was maintained by CD44 independently of its extracellular domain. Instead, migratory polarity depended on the recruitment of ezrin, radixin, moesin (ERM) proteins by the intracellular domain of CD44 to the posterior cellular protrusion. Our results formally demonstrate that CD44-dependent T lymphocyte locomotion within target sites represents an essential immunologic checkpoint that determines the potency of T cell effector functions.


Figures

Figure 1
Figure 1. CD44 regulates the navigation of killer T cells through the tumor microenvironment
(A-F) C57BL/6 mice were injected s.c. with EL4-cells (106) not expressing cognate antigen for OT-I T cells. After the tumors became palpable, CTL (2×10⁷) at day 8 of stimulation generated from OT-IxDPEGFP or OT-IxCD44-/-xDPEGFP were adoptively transferred through the tail-vein. Three days later, the tumors (n=14) were explanted and subjected to two-photon microscopy. T cells were tracked and analyzed. (A, B) Representative tracks of migrating T cells (8’45”). (C) The distribution of the mean velocity of individual tracks is plotted. Arrows indicate the median velocity. (D) Individual tracks of migrating cells were plotted according to their confinement ratio and mean velocity. Quadrants were set to distinguish 4 populations of cells. Symbols represent tracks of individual cells. (E) The distribution of the individual tracks within the 4 quadrants shown in (D) is depicted. (F) A square root of time versus displacement plot was calculated from the tracks in quadrant 3. (G-I) As in (C-E) except that mice were injected with E.G7-OVA tumors (n=3) instead of EL4 tumor cells and that two-photon imaging was carried out 4 days after adoptive transfer.
Figure 2
Figure 2. Direct regulation of TIL motility by CD44
(A-D) E.G7-OVA tumor bearing mice (as in Figure 1) were co-injected i.v. with 1.5×10⁷ ECFP-OT-I and YFP-OT-IxCD44-/- CTL. Tumors (n=5) were explanted on day 4 after adoptive transfer. Two-photon imaging of ECFP+ and YFP+ cells and cell tracking analysis was carried as in Figure 1. (E-H) OT-IxCD44-/- CTL transduced with ECFP alone or CD44-IRES-GFP (1.5×10⁷ cells each) were adoptively transferred into EL4 tumor bearing mice. Tumors (n=2) were explanted on day 3 after adoptive transfer. Two-photon imaging of ECFP+ and GFP+ cells and cell tracking analysis was carried out as in Figure 1.
Figure 3
Figure 3. CD44 promotes polarity of effector CTL in vitro and in vivo
(A-C) CTL generated from OT-I or OT-IxCD44-/- mice at day 8 of culture were placed on top of a collagen gel. Using phase contrast microscopy, time-lapse sequences of the migratory behavior of the cells were generated. Frames were captured every 30 seconds for a period of 10.5 minutes. This was followed by tracking and data analysis as in Figure 1. Note that due to the faster migration velocities of T cells in vitro, gates in panel (B) were set differently for the cell culture experiments as compared to in vivo. (D) T cell adhesion assay on 96 well plates uncoated or coated with collagen or fibronectin. Shown is the percentage of the adhering cells (n=32 wells for each condition in 4 independent experiments). (E-G) CTL cultured on plastic-dishes were imaged with phase contrast microscopy. Cells were categorized and quantified according to their cell shape. (H-J) Phase contrast microscopy was used to generate time-lapse sequences of CTL cultured on plastic dishes. The number of switches between round and extended shape was quantified (n= 81/67 OT-I/OT-IxCD44-/- cells). Indicated are the means of the percentages of switch-frequencies within individual time lapse-sequences (J, n=15 image sequences). Significance was tested using two-way ANOVA. (K) The experiment was carried out as in Figure 1. Snapshots of time lapse videos generated in Figure 1 were taken, and the percentage of GFP+ cells containing uropods determined. Each symbol represents the value obtained in an individual region (4 independent experiments).
Figure 4
Figure 4. The intracellular domain of CD44 promotes T lymphocyte migration in vitro
(A-C) CTL generated from OT-IxCD44-/- mice were transduced with a retrovirus conferring expression of GFP and CD44 (MigR1-CD44) or GFP only (MigR1). Time-lapse sequences of CTL migrating on a collagen gel were captured simultaneously with phase-contrast and fluorescence microscopy to track GFP+ (transduced) and GFP- (non-transduced) CTL, respectively. Data analysis was carried out as in Figure 1. (D) Schematic representation of the different forms of CD44 used in the experiments. (E) CTL generated from OT-IxCD44-/- mice were transduced with retrovirus conferring co-expression of GFP and the CD44 variants symbolized in (D). Migratory velocities were determined. (F, G) CTL generated from OT-IxCD44-/- mice were transduced with FGM-retrovirus conferring expression of the CD44-GFP variants symbolized in (D). (F) CD44 expression on GFP+ cells was analyzed by flow cytometry. (G) Representative GFP+ T cells in the individual groups were captured with fluorescence microscopy.
Figure 5
Figure 5. Recruitment of ERM is required for the promigratory effect of CD44 in killer T lymphocytes
(A) CTL were permeabilized and stained with mAb against pERM and analyzed by immunofluorescence microscopy. The percentage of cells with polarized localization of pERM was determined. Statistical significance was calculated using the Chi-Square test. (B-G) CTL generated from OT-IxCD44-/- mice were transduced with a retrovirus conferring expression of the indicated CD44-GFP constructs. (B) CD44 expression on GFP+ cells was analyzed by flow cytometry. (C, D) Representative snapshots of in vitro cultured CTL transduced with CD44-GFP or CD44ΔERM-GFP. (E-G) The motility of CTL transduced with the indicated retroviral constructs on collagen gels was analyzed as in Figure 1.
Figure 6
Figure 6. CD44 modulates target cell screening efficacy, but is not involved in physical interactions between killer T lymphocytes and tumor cells
C57BL/6 mice were injected subcutaneously into the flank with E.G7-OVA-ECFP tumor cells (106). After 9 days, 2×10⁶, 5×10⁶ or 2×10⁷ CTL generated from OT-IxDPEGFP or OT-IxCD44-/-xDPEGFP splenocytes were adoptively transferred. 2, 3 and 4 days later, the tumors were explanted and subjected to two-photon microscopy. (n=day 2, WT: 3 tumors, KO: 3 tumors; day 3, WT: 4 tumors, KO: 5 tumors; day 4, WT: 5 tumors, KO: 3 tumors for each T cell group). (A) Snapshots from time-lapse sequences from mice that received 2×10⁶ CTL are shown. CTL (green) are indicated with green arrowheads. Individual tumor cells are labeled with numbers to identify them throughout the observation period. The time is indicated in min:sec in the upper right corner of each panel. (B) Tumor regions from mice that received 2×10⁶ CTL were analyzed for the frequency of cellular interactions. Only CTL that could be tracked for 30 minutes, engaged in at least one short-term interaction (<10 minutes) with a tumor cell and did not show any long-term interactions were included. The number of tumor cells that were targeted by these cells was counted. The data were generated from 3 independent experiments (WT: n=10 CTL; KO: n= 13). (C) The areas analyzed in (B) were also analyzed for the time required for TIL to establish contacts with tumor cells. TIL that were not in contact with tumor cells were tracked until they made contact with a tumor cell. The elapsed time-period was measured and plotted. (D) The areas analyzed in (B) were used to determine the number of TIL that succeed in establishing contacts with tumor cells. TIL were observed for a 30 minute time period. Cells that achieved contacts with at least 1 tumor cell were designated “interacting” cells, cells that failed to achieve contacts with any tumor cells were designated “non-interacting” cells. Shown is the number of interacting and non-interacting T cells. (E) A representative long- term interaction between an OT-IxCD44-/- T cell and an E.G7-OVA-ECFP tumor cell is shown. The time is indicated in the upper left corner of each panel (minutes:seconds). (F) The duration of interactions between E.G7-OVA-ECFP tumor cells and CD44-expressing or CD44-deficient CTL was measured (2×10⁷: n=46/69 interactions; 5×10⁶: n= 41/52 interactions; 2×10⁶: n= 47/60 interactions).
Figure 7
Figure 7. CD44 enhances the potency of the effector immune response
C57BL/6 mice were injected subcutaneously with E.G7-OVA cells (106). After 9-10 days, 2×10⁷ (A) or 2×10⁶ (B-E) CTL generated from OT-IxDPEGFP or OT-IxCD44-/-xDPEGFP mice were adoptively transferred into tumor-bearing mice. (A) n=58 tumors for each T cell group; (B-E) n=30/28 tumors for OT-I and OT-IxCD44-/- CTL, respectively. (A, B) The mean tumor volume was calculated for each group. (C) The proportion of mice with tumors larger than 100 mm3 after adoptive transfer is depicted. Chi-square test was used for each time point to determine if the proportion of rejected tumors in each group were different (**: P<0.005; *: P<0.05; $: P>0.1;). (D) The mean volume only of tumors with a size larger than 100 mm3 (day 10) was determined. Repeated measures two-way ANOVA was carried out to determine whether interaction occurs between the two curves (n=6/11 tumors). (E) Survival curves of tumor-bearing mice that were treated with OT-IxDPEGFP or OT-IxCD44-/-xDPEGFP T cells (n=15/14 mice) were determined. (F) C56BL/6 mice were injected subcutaneously with EL4 tumor cells (106). At the indicated time-points single cell suspensions of the tumors were generated, and the number of OT-I and OT-IxCD44-/- TIL were determined by flow cytometry (day 3: n=16/14 tumors; day 6: n=20 tumors; day 9: n=4 tumors).

Comment in

References

    1. Alstergren P, Zhu B, Glogauer M, Mak TW, Ellen RP, Sodek J. Polarization and directed migration of murine neutrophils is dependent on cell surface expression of CD44. Cell Immunol. 2004;231:146–157. - PubMed
    1. Bajenoff M, Egen JG, Koo LY, Laugier JP, Brau F, Glaichenhaus N, Germain RN. Stromal cell networks regulate lymphocyte entry, migration, and territoriality in lymph nodes. Immunity. 2006;25:989–1001. - PMC - PubMed
    1. Bousso P, Robey EA. Dynamic behavior of T cells and thymocytes in lymphoid organs as revealed by two-photon microscopy. Immunity. 2004;21:349–355. - PubMed
    1. Bretscher A, Edwards K, Fehon RG. ERM proteins and merlin: integrators at the cell cortex. Nat Rev Mol Cell Biol. 2002;3:586–599. - PubMed
    1. Cahalan MD, Parker I. Choreography of cell motility and interaction dynamics imaged by two-photon microscopy in lymphoid organs. Annual review of immunology. 2008;26:585–626. - PMC - PubMed

Publication types

MeSH terms