

The representation of object viewpoint in human visual cortex
- PMID: 19100844
- PMCID: PMC4415527
- DOI: 10.1016/j.neuroimage.2008.11.009
The representation of object viewpoint in human visual cortex
Abstract
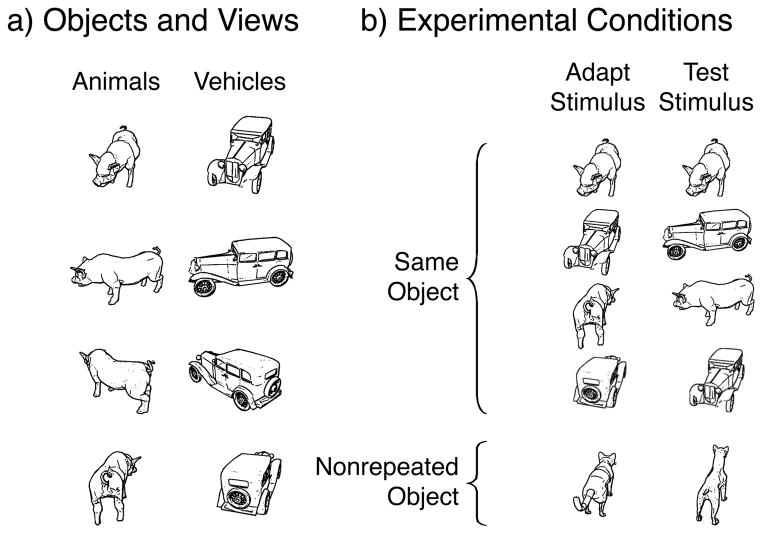
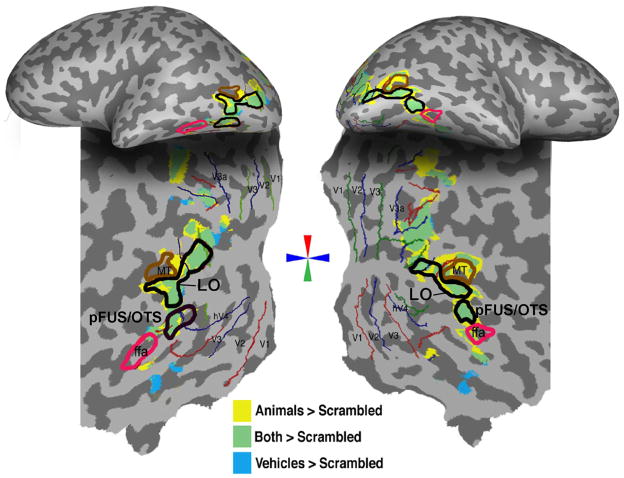
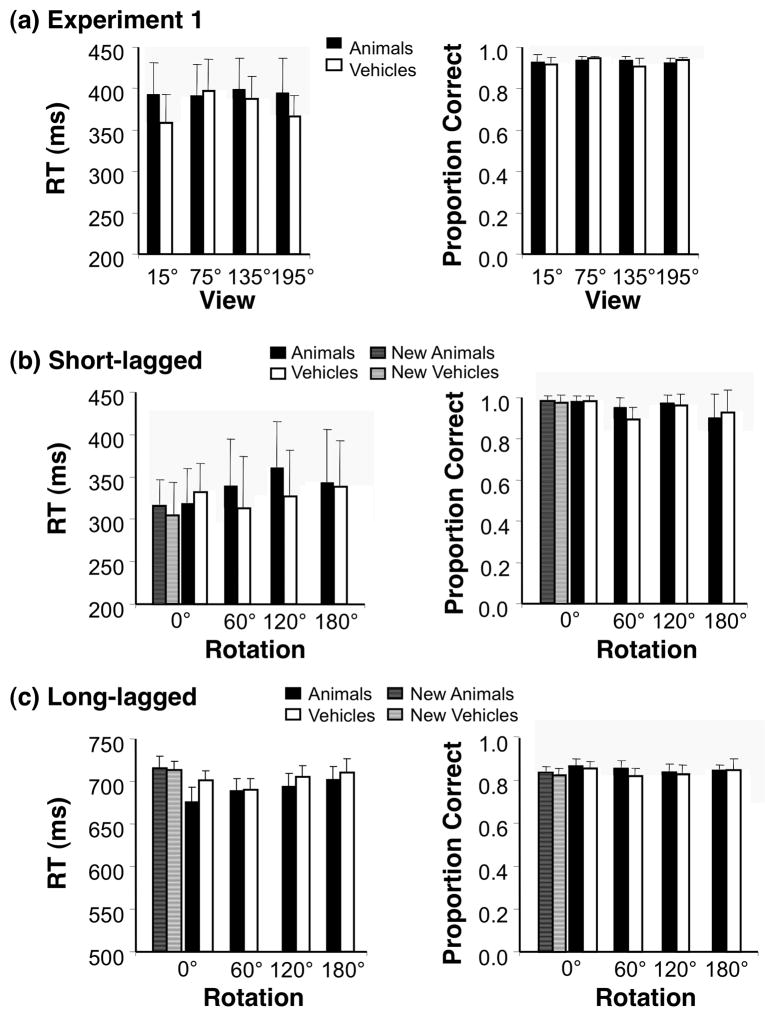
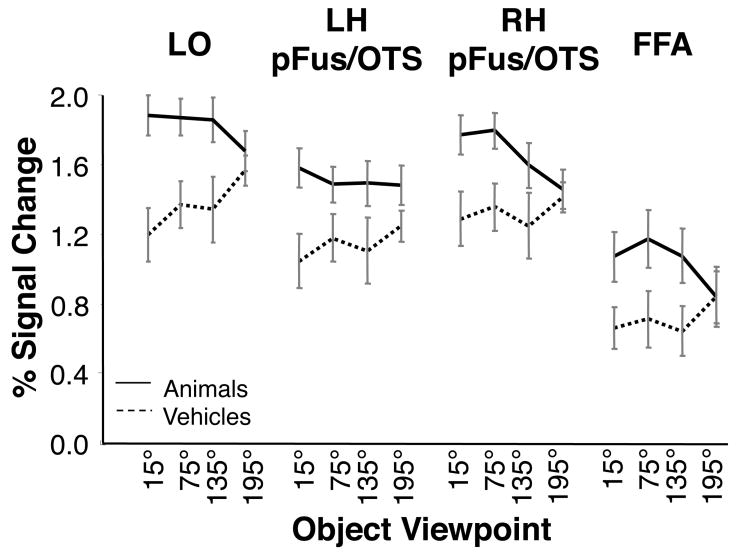
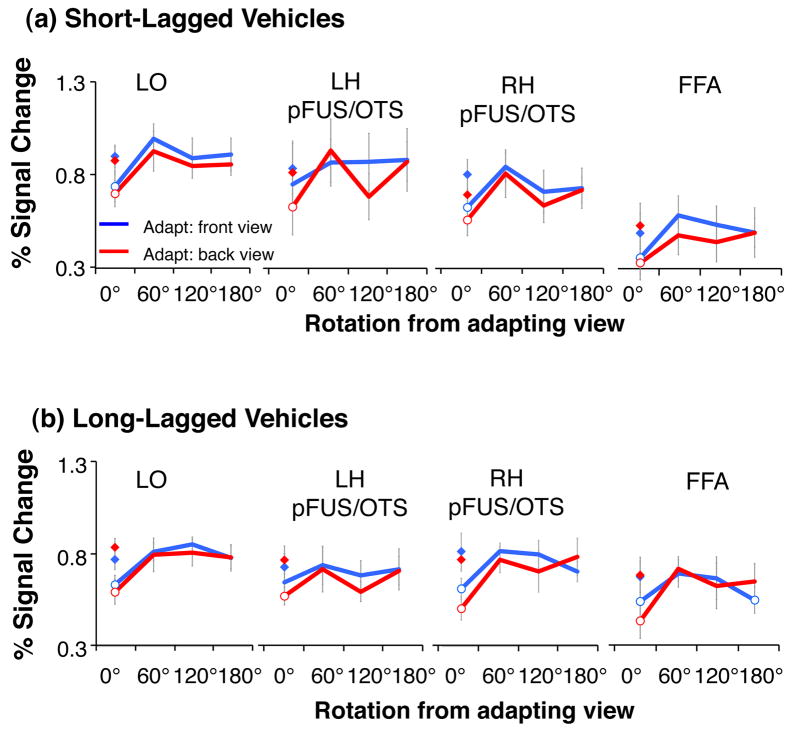
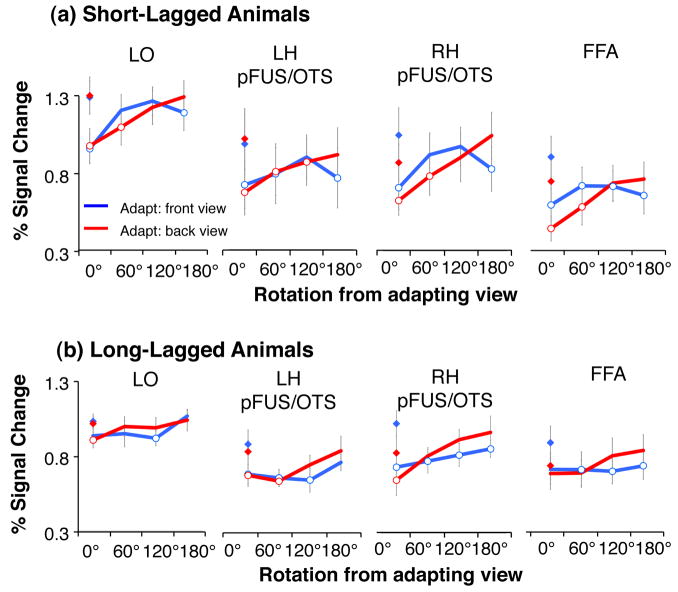
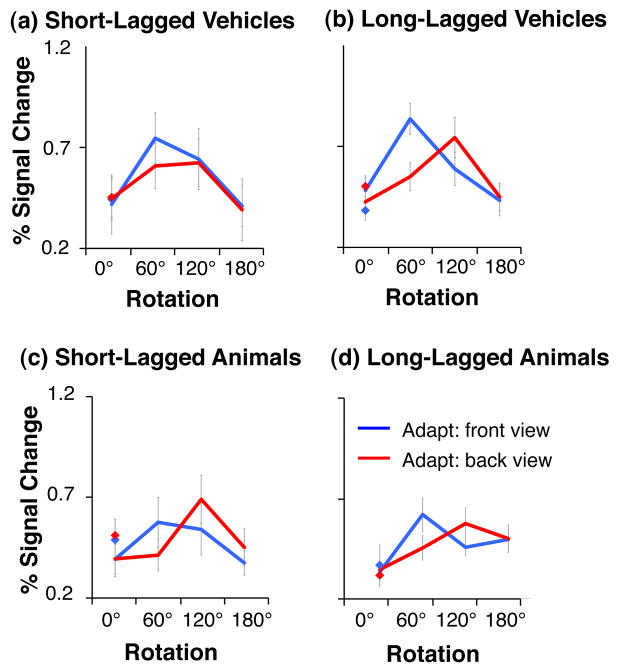
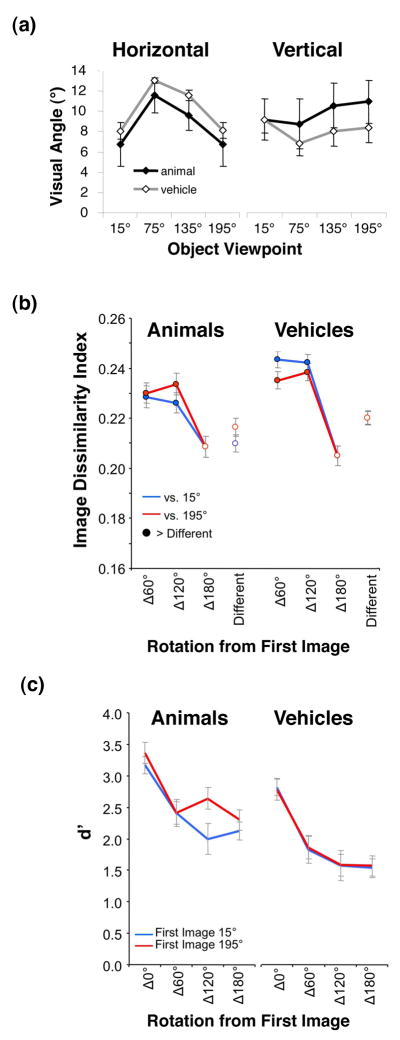
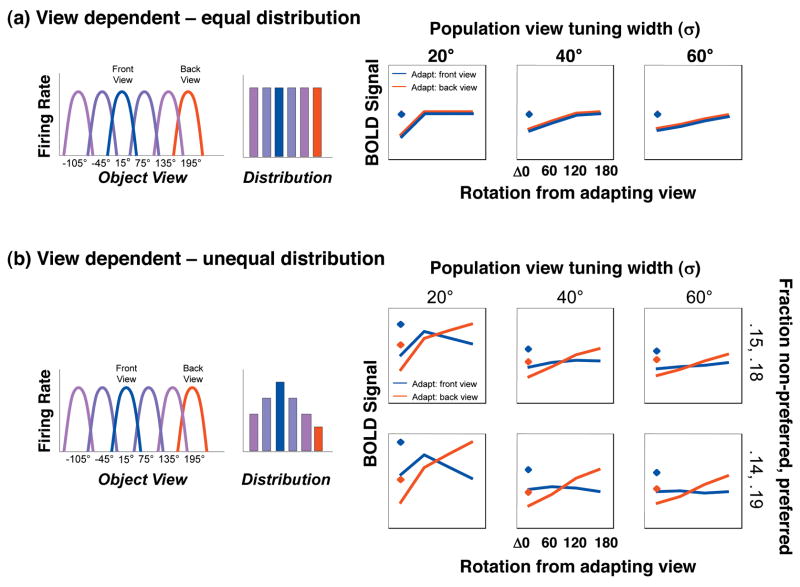
Understanding the nature of object representations in the human brain is critical for understanding the neural basis of invariant object recognition. However, the degree to which object representations are sensitive to object viewpoint is unknown. Using fMRI we employed a parametric approach to examine the sensitivity to object view as a function of rotation (0 degrees-180 degrees ), category (animal/vehicle) and fMRI-adaptation paradigm (short or long-lagged). For both categories and fMRI-adaptation paradigms, object-selective regions recovered from adaptation when a rotated view of an object was shown after adaptation to a specific view of that object, suggesting that representations are sensitive to object rotation. However, we found evidence for differential representations across categories and ventral stream regions. Rotation cross-adaptation was larger for animals than vehicles, suggesting higher sensitivity to vehicle than animal rotation, and was largest in the left fusiform/occipito-temporal sulcus (pFUS/OTS), suggesting that this region has low sensitivity to rotation. Moreover, right pFUS/OTS and FFA responded more strongly to front than back views of animals (without adaptation) and rotation cross-adaptation depended both on the level of rotation and the adapting view. This result suggests a prevalence of neurons that prefer frontal views of animals in fusiform regions. Using a computational model of view-tuned neurons, we demonstrate that differential neural view tuning widths and relative distributions of neural-tuned populations in fMRI voxels can explain the fMRI results. Overall, our findings underscore the utility of parametric approaches for studying the neural basis of object invariance and suggest that there is no complete invariance to object view in the human ventral stream.
Figures
Similar articles
-
The integration of higher order form and motion by the human brain.Neuroimage. 2008 Oct 1;42(4):1529-36. doi: 10.1016/j.neuroimage.2008.04.265. Epub 2008 May 13. Neuroimage. 2008. PMID: 18691907
-
fMRI-adaptation studies of viewpoint tuning in the extrastriate and fusiform body areas.J Neurophysiol. 2010 Mar;103(3):1467-77. doi: 10.1152/jn.00637.2009. Epub 2009 Dec 23. J Neurophysiol. 2010. PMID: 20032242
-
Mental rotation and object categorization share a common network of prefrontal and dorsal and ventral regions of posterior cortex.Neuroimage. 2007 Apr 15;35(3):1264-77. doi: 10.1016/j.neuroimage.2007.01.012. Epub 2007 Jan 27. Neuroimage. 2007. PMID: 17346989
-
Orientation Encoding and Viewpoint Invariance in Face Recognition: Inferring Neural Properties from Large-Scale Signals.Neuroscientist. 2018 Dec;24(6):582-608. doi: 10.1177/1073858418769554. Epub 2018 Jun 1. Neuroscientist. 2018. PMID: 29855217 Review.
-
Visual Object Recognition: Do We (Finally) Know More Now Than We Did?Annu Rev Vis Sci. 2016 Oct 14;2:377-396. doi: 10.1146/annurev-vision-111815-114621. Epub 2016 Aug 3. Annu Rev Vis Sci. 2016. PMID: 28532357 Review.
Cited by
-
Repetition priming and repetition suppression: Multiple mechanisms in need of testing.Cogn Neurosci. 2012;3(3-4):250-9. doi: 10.1080/17588928.2012.697054. Cogn Neurosci. 2012. PMID: 24171755 Free PMC article.
-
Dynamics of 3D view invariance in monkey inferotemporal cortex.J Neurophysiol. 2015 Apr 1;113(7):2180-94. doi: 10.1152/jn.00810.2014. Epub 2015 Jan 21. J Neurophysiol. 2015. PMID: 25609108 Free PMC article.
-
Conjunctive Coding of Complex Object Features.Cereb Cortex. 2016 May;26(5):2271-2282. doi: 10.1093/cercor/bhv081. Epub 2015 Apr 28. Cereb Cortex. 2016. PMID: 25921583 Free PMC article.
-
fMR-Adaptation Reveals Invariant Coding of Biological Motion on the Human STS.Front Hum Neurosci. 2010 Mar 23;4:15. doi: 10.3389/neuro.09.015.2010. eCollection 2010. Front Hum Neurosci. 2010. PMID: 20431723 Free PMC article.
-
fMRI-adaptation and category selectivity in human ventral temporal cortex: regional differences across time scales.J Neurophysiol. 2010 Jun;103(6):3349-65. doi: 10.1152/jn.01108.2009. Epub 2010 Apr 7. J Neurophysiol. 2010. PMID: 20375251 Free PMC article.
References
-
- Avidan G, Hasson U, Hendler T, Zohary E, Malach R. Analysis of the neuronal selectivity underlying low fMRI signals. Curr Biol. 2002;12:964–972. - PubMed
-
- Basri R, Ullman S. Computer Vision. 1988. The alignment of objects with smooth surfaces.
-
- Biederman I. Recognition-by-components: a theory of human image understanding. Psychol Rev. 1987;94:115–147. - PubMed
-
- Biederman I, Rabinowitz JC, Glass AL, Stacy EW., Jr On the information extracted from a glance at a scene. J Exp Psychol. 1974;103:597–600. - PubMed
-
- Booth MC, Rolls ET. View-invariant representations of familiar objects by neurons in the inferior temporal visual cortex. Cereb Cortex. 1998;8:510–523. - PubMed
Publication types
MeSH terms
Grants and funding
LinkOut - more resources
Full Text Sources
Medical
