

n-Gram characterization of genomic islands in bacterial genomes
- PMID: 19101056
- PMCID: PMC7185697
- DOI: 10.1016/j.cmpb.2008.10.014
n-Gram characterization of genomic islands in bacterial genomes
Abstract
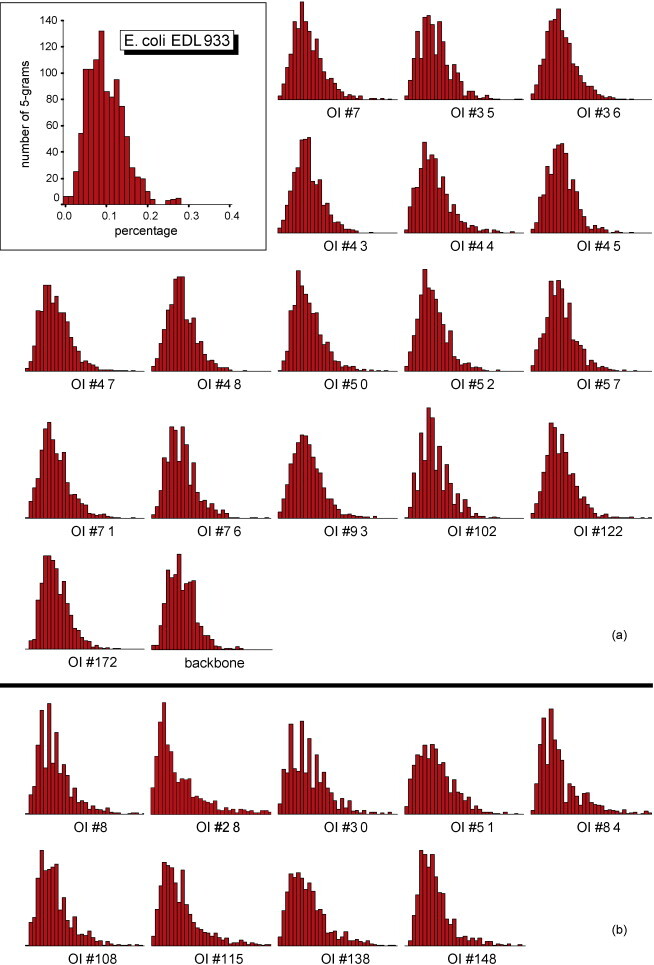
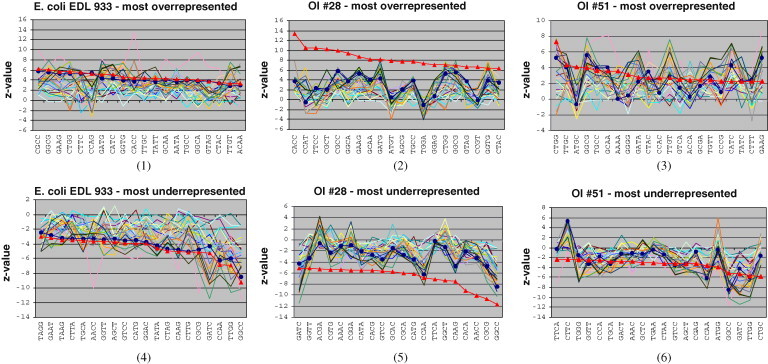
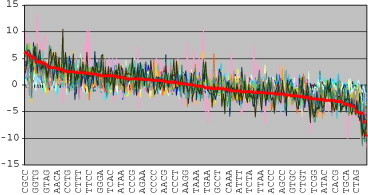
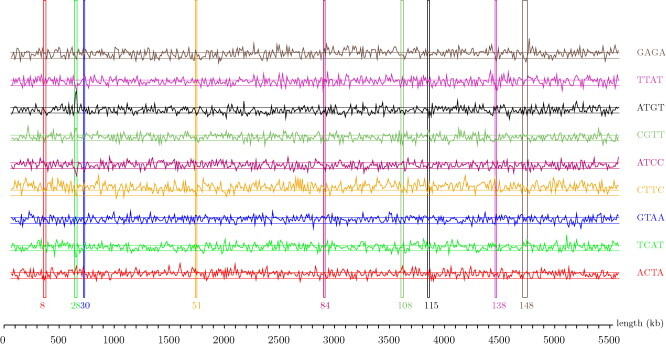
The paper presents a novel, n-gram-based method for analysis of bacterial genome segments known as genomic islands (GIs). Identification of GIs in bacterial genomes is an important task since many of them represent inserts that may contribute to bacterial evolution and pathogenesis. In order to characterize and distinguish GIs from rest of the genome, binary classification of islands based on n-gram frequency distribution have been performed. It consists of testing the agreement of islands n-gram frequency distributions with the complete genome and backbone sequence. In addition, a statistic based on the maximal order Markov model is used to identify significantly overrepresented and underrepresented n-grams in islands. The results may be used as a basis for Zipf-like analysis suggesting that some of the n-grams are overrepresented in a subset of islands and underrepresented in the backbone, or vice versa, thus complementing the binary classification. The method is applied to strain-specific regions in the Escherichia coli O157:H7 EDL933 genome (O-islands), resulting in two groups of O-islands with different n-gram characteristics. It refines a characterization based on other compositional features such as G+C content and codon usage, and may help in identification of GIs, and also in research and development of adequate drugs targeting virulence genes in them.
Figures
Similar articles
-
Score-based prediction of genomic islands in prokaryotic genomes using hidden Markov models.BMC Bioinformatics. 2006 Mar 16;7:142. doi: 10.1186/1471-2105-7-142. BMC Bioinformatics. 2006. PMID: 16542435 Free PMC article.
-
A computational approach for identifying pathogenicity islands in prokaryotic genomes.BMC Bioinformatics. 2005 Jul 21;6:184. doi: 10.1186/1471-2105-6-184. BMC Bioinformatics. 2005. PMID: 16033657 Free PMC article.
-
Prediction of pathogenicity islands in enterohemorrhagic Escherichia coli O157:H7 using genomic barcodes.FEBS Lett. 2010 Jan 4;584(1):194-8. doi: 10.1016/j.febslet.2009.11.067. FEBS Lett. 2010. PMID: 19941858
-
Identification and characterization of pathogenicity and other genomic islands using base composition analyses.Future Microbiol. 2006 Oct;1(3):309-16. doi: 10.2217/17460913.1.3.309. Future Microbiol. 2006. PMID: 17661643 Review.
-
Detecting genomic islands using bioinformatics approaches.Nat Rev Microbiol. 2010 May;8(5):373-82. doi: 10.1038/nrmicro2350. Nat Rev Microbiol. 2010. PMID: 20395967 Review.
Cited by
-
N-gram analysis of 970 microbial organisms reveals presence of biological language models.BMC Bioinformatics. 2011 Jan 10;12:12. doi: 10.1186/1471-2105-12-12. BMC Bioinformatics. 2011. PMID: 21219653 Free PMC article.
-
A large scale comparative genomic analysis reveals insertion sites for newly acquired genomic islands in bacterial genomes.BMC Microbiol. 2011 Jun 15;11:135. doi: 10.1186/1471-2180-11-135. BMC Microbiol. 2011. PMID: 21672261 Free PMC article.
-
IGIPT - Integrated genomic island prediction tool.Bioinformation. 2011;7(6):307-10. doi: 10.6026/007/97320630007307. Epub 2011 Nov 20. Bioinformation. 2011. PMID: 22355227 Free PMC article.
References
-
- Karlin S. Detecting anomalous gene clusters and pathogenicity islands in diverse bacterial genomes. Trends Microbiol. 2001;9(7):335–343. - PubMed
-
- Blattner F.R., Ill G.P., Blochet C.A., Perna N.T., Burland V., Riley M., Collado-Vides J., Glasner J.D., Rode C.K., Mayhew G.F., Gregor J., Davis N.V., Kirkpatrick H.A., Goeden M.A., Rose D.J., Mau B., Shao Y. The complete genome sequence of Escherichia coli K-12. Science. 1997;277:1453–1462. - PubMed
-
- Perna N.T., Plunkett G., III, Burland V., Mau B., Glasner J.D., Rose D.J., Mayhew G.F., Evans P.S., Gregor J., Kirkpatrick H.A., Posfai G., Hackett J., Klink S., Boutin A., Shao Y., Miller L., Grotbeck E.J., Davis N.W., Limk A., Dimalantak E.T., Potamousis K.D., Apodaca J., Anantharaman T.S., Lin J., Yen G., Schwartz D.C., Welch R.A., Blattner F.R. Genome sequence of enterohemorrhagic Escherichia coli O157:H7. Nature. 2001;409:529–533. - PubMed
Publication types
MeSH terms
Substances
LinkOut - more resources
Full Text Sources
