. 2009 Feb 18;158(4):1311-25.
doi: 10.1016/j.neuroscience.2008.11.032. Epub 2008 Nov 27.

Cyclic AMP-dependent protein kinase A and protein kinase C phosphorylate alpha4beta2 nicotinic receptor subunits at distinct stages of receptor formation and maturation

Affiliations

Cyclic AMP-dependent protein kinase A and protein kinase C phosphorylate alpha4beta2 nicotinic receptor subunits at distinct stages of receptor formation and maturation

V V Pollock et al. Neuroscience. .

Abstract

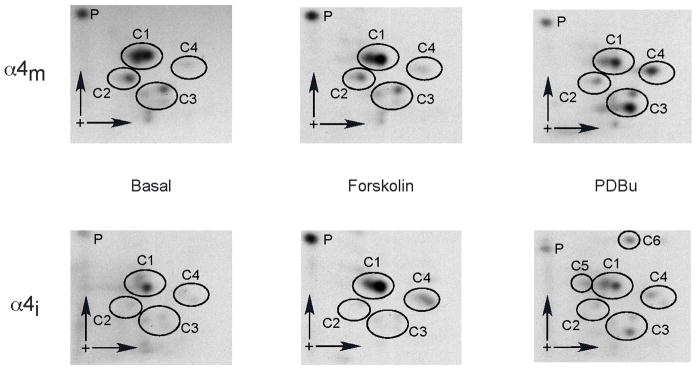
Neuronal nicotinic receptor alpha4 subunits associated with nicotinic alpha4beta2 receptors are phosphorylated by cyclic AMP-dependent protein kinase (PKA) and protein kinase C (PKC), but the stages of receptor formation during which phosphorylation occurs and the functional consequences of kinase activation are unknown. SH-EP1 cells transfected with DNAs coding for human alpha4 and/or beta2 subunits were incubated with (32)Pi, and PKA or PKC was activated by forskolin or phorbol 12,13-dibutyrate, respectively. Immunoprecipitation and immunoblotting of proteins from cells expressing alpha4beta2 receptors or only alpha4 subunits were used to identify free alpha4 subunits, and alpha4 subunits present in immature alpha4beta2 complexes and mature alpha4beta2 pentamers containing complex carbohydrates. In the absence of kinase activation, phosphorylation of alpha4 subunits associated with mature pentamers was three times higher than subunits associated with immature complexes. PKA and PKC activation increased phosphorylation of free alpha4 subunits on different serine residues; only PKC activation phosphorylated subunits associated with mature alpha4beta2 receptors. Activation of both PKA and PKC increased the density of membrane-associated receptors, but only PKC activation increased peak membrane currents. PKA and PKC activation also phosphorylated beta2 subunits associated with mature alpha4beta2 receptors. Results indicate that activation of PKA and PKC leads to the phosphorylation alpha4beta2 receptors at different stages of receptor formation and maturation and has differential effects on the expression and function of human alpha4beta2 receptors.


Figures

Fig. 1
Fig. 1
Immunoprecipitation of human nicotinic receptor α4 and β2 subunits by mAb290 and mAb299. SH-EP1 cells were transfected with DNAs coding for α4 and β2 subunits alone or in combination (α4:β2, 2:3). [A] A representative immunoblot identifying α4 and β2 subunits immunoprecipitated by mAb299 versus mAb290. Whole cell lysates were prepared and proteins were immunoprecipitated with either mAb299 (directed against α4 subunits) or mAb290 (directed against β2 subunits). Samples were separated on SDS-PAGE gels and transferred to PVDF membranes. The membranes were cut just above the 59 kDa marker and the top half was probed for α4 with the H-133 antibody and the bottom half was probed for β2 with the H-92 antibody; molecular weight standards are indicated. [B] Representative immunoblots from non-biotinylated and biotinylated proteins prior to and following endoglycosidase cleavage. Surface proteins were labeled with Sulfo-NHS-LC-Biotin 24 hours following transfections, whole cell lysates prepared, α4β2 complexes immunoprecipitated with mAb290, and samples separated on SDS-PAGE gels and transferred to PVDF membranes. Non-biotinylated samples were probed for α4 and β2 subunits with H-133 and H-92, respectively, and biotinylated proteins were probed with peroxidase-conjugated extravidin. For each condition, samples were untreated (lane 1) or digested with the endoglycosidases Endo-H (lane 2) or PNGase F (lane 3). α4m and β2m represent subunits immunoprecipitated from fully processed mature pentamers present mostly in the plasma membrane, and α4i and β2i represent subunits immunoprecipitated from immature complexes located in the endoplasmic reticulum. [C] Sequential immunoprecipitations and detergent comparison. Following transfection, whole cell lysates were prepared in buffer containing either 2% Triton X-100 or 1% Lubrol. Subunits were immunoprecipitated sequentially with the indicated antibodies, and samples were separated on SDS-PAGE gels and transferred to PVDF membranes. The membranes were cut just above the 59 kDa marker and the top half was probed for α4 with the H-133 antibody and the bottom half was probed for β2 with the H-92 antibody.
Fig. 2
Fig. 2
In vivo phosphorylation of immature and mature α4 subunits. SH-EP1 cells transfected with DNAs coding for α4 and β2 subunits (α4:β2, 2:3) were incubated with 32Pi (1 or 2 mCi/ml) for 4 hours, the final 15 or 30 minutes in 10 μM forskolin or 200 nM PDBu, respectively. Whole cell lysates were prepared, α4β2 complexes were immunoprecipitated with mAb290, and samples were separated on SDS-PAGE gels and transferred to PVDF membranes. Radioactivity was visualized by autoradiography by exposing the membranes to film prior to cutting them horizontally just above the 59 kDa marker. The top and bottom halves of the membranes were probed for subunit protein using H-133 for α4 and H-92 for β2 subunit, respectively. A representative autoradiograph and immunoblot are shown depicting α4m and β2m (subunits from fully processed pentamers) and α4i and β2i (immature subunit complexes). Relative phosphorylation was determined as the ratio of the densitometric signals from the autoradiographs to the immunoblots. Bars represent the mean + s.e.m. from 4–6 experiments. The asterisks denote significant differences relative to corresponding basal values, p<0.05.
Fig 3
Fig 3
2D phosphopeptide maps of immature and mature α4 subunits following stimulation of PKA or PKC. SH-EP1 cells were transfected, incubated and proteins immunoprecipitated and separated as in Fig. 2. The [32P]-labeled α4i and α4m bands were excised from the PVDF membranes, digested with trypsin, and spotted on TLC plates. Phosphopeptides were separated by electrophoresis in the horizontal dimension and ascending chromatography in the vertical dimension, and detected by autoradiography. Representative maps (from a total of 3 for each condition) from unstimulated cells (basal) or cells incubated in the presence of forskolin or PDBu are shown. Phosphopeptide clusters are grouped within circles.
Fig 4
Fig 4
In vivo phosphorylation of homomeric α4 subunits. SH-EP1 cells were transfected with the DNA coding for either [A] α4 subunits only or [B] both α4 and β2 subunits. Cells were incubated with 32Pi for 4 hours, the final 15 or 30 minutes in 10 μM forskolin or 200 nM PDBu, respectively, and whole cell lysates prepared as in Fig 2. [A] α4 subunits were immunoprecipitated with mAb299. [B] All α4 subunits assembled with β2 subunits were removed by sequential immunoprecipitation with mAb290 and excess H-92. The remaining α4 subunits (α4) were immunoprecipitated with mAb299. Samples were separated on SDS-PAGE gels and transferred to PVDF membranes. Radioactivity was visualized by autoradiography, and subunit protein probed for α4 with H-133. A representative autoradiograph and immunoblot are shown. Relative phosphorylation was calculated as the ratio of densitometric signals from the autoradiographs to the immunoblots. Each bar represents the mean + s.e.m. from 4–6 experiments. The asterisks denote significant differences relative to corresponding basal values, p<0.05. For 2D phosphopeptide maps, the [32P]-labeled α4 band was excised from the PVDF membranes, washed, digested with trypsin, and spotted on TLC plates as in Fig. 3. Phosphopeptide clusters are grouped within circles and labeled as in Fig. 3.
Fig. 5
Fig. 5
Effects of forskolin and PDBu on α4β2 receptor density and function. [A] SH-EP1-hα4β2 cells were incubated in the absence or presence of 10 μM forskolin or 200 nM PDBu for 24 hours, membrane fractions prepared, and binding at 2.5 nM [3H]cytisine was determined. Bars represent group mean values + s.e.m. from 7 experiments. The asterisk denotes a significant difference from basal values, p<0.05. [B] Responses of cells to varying concentrations of ACh. Membrane currents were measured using the perforated patch configuration of the whole-cell voltage clamp technique. The cell was held at −60 mV and membrane currents evoked by rapid application of ACh at the indicated concentrations. The horizontal bar indicates the time during the application of ACh (400 msec). A recording from a representative cell is shown on the left and cumulative data depicting normalized peak ACh-induced inward currents as a function of ACh concentration on the right. Peak currents were normalized to currents measured in response to 3 mM ACh for each cell. Each point represents data obtained from 12–16 cells ± s.e.m. The solid line represents the results of a fit of the data to a 2-site Langmuir-Hill equation, while the dashed line shows a fit of the data to a 1-site equation. [C] Current-voltage relationship for ACh-evoked peak current amplitudes. A representative family of traces of ACh-activated current responses from a cell held at the indicated potentials and currents evoked using 2 mM ACh (400 msec). The mean peak ACh-induced inward currents as a function of holding potential are shown. Peak current amplitudes were normalized to the absolute peak measured at −60 mV for each cell in response to 2 mM ACh. Each point represents data from 7–9 cells ± s.e.m. [D] Modulation of ACh-evoked current density in SH-EP1-hα4β2 cells following activation of PKA or PKC. Cells were incubated in the absence or presence of 10 μM forskolin or 200 nM PDBu for 24 hours, washed, and membrane currents in response to 2 mM ACh were measured using the perforated patch configuration of the whole-cell voltage clamp technique; cells were held at −60 mV. Bar graphs depict group mean values + s.e.m. of current densities (normalized to controls). The control ACh current density was −103 ± 5.5 pA/pF; n=9 cells from each group. The asterisk denotes a significant difference from basal values, p<0.05.
Fig 6
Fig 6
Modulation of ACh-evoked currents in SH-EP1-hα4β2 cells by PDBu. Cells were incubated in the absence or presence of 200 nM PDBu or 100 nM Ro-31-8220 alone or in combination for different periods of time, and membrane currents in response to 2 mM ACh were measured following washing using the perforated patch configuration of the whole-cell voltage clamp technique; cells were held at −60 mV. The horizontal bars indicate the time of ACh application (1.5 sec). Representative current traces and bar graphs depicting group mean values + s.e.m. of current densities (normalized to controls) are shown. [A] Cells were incubated for 24 hours with the indicated compounds and washed for 10 minutes prior to recording. The control ACh current density was −71.6 ± 5.1 pA/pF (n=54). The sample size (n) for the other groups were: 17 for DMSO, Ro-31-8220 and Ro + PDBu; and 29 for PDBu alone. [B] Cells were incubated for 1 hour with the indicated compounds followed by an extensive 10 minute washout prior to recording. The control ACh current density was −57.3 ± 3.7 pA/pF (n=47). The sample sizes (n) for the other groups were 13 for DMSO and 25 for PDBu. [C] Cells were incubated for 1 hour with the indicated compounds followed by washout and 23 hours of incubation in control media prior to recording. The control ACh current density was −74.1 ± 4.6 pA/pF (n=61). The sample sizes (n) for the other groups were: 16 for DMSO; 13 for Ro-31-8220; 28 for PDBu; 19 for Ro + PDBu. The asterisks denote significant differences from control (p < 0.05).
Fig. 7
Fig. 7
Putative sites of action of PKA and PKC on α4β2 receptors. The schematic depicts the stages in the assembly, maturation and trafficking of α4β2 receptors during which subunits may be phosphorylated (or dephosphorylated). Immature α4 subunits (α4i) are shown representing free, unassembled subunits and immature subunit complexes containing high mannose in the endoplasmic reticulum. Mature α4 subunits (α4m) are shown representing fully processed mature forms with complex carbohydrates associated with the Golgi and plasma membrane. Results from phosphorylation and differential immunoprecipitation experiments indicate that free α4 subunits are phosphorylated by both PKA and PKC, the former on Ser362 and Ser467, and the latter on two as yet unidentified serine residues (within C5 and C6). Phosphorylation at these sites promotes the assembly of subunits, followed sequentially by the PKC-mediated phosphorylation of Ser550. Although the schematic depicts all immature complexes phosphorylated by PKC, these complexes exist in at least two conformations, a juvenile form which can be immunoprecipitated with mAb299 and a late developmental form, which can be immunoprecipitated by mAb290 (Sallette et al., 2005). It is possible that phosphorylation by PKC occurs only on one form, and that provides the signal for the exiting of the receptor from the endoplasmic reticulum. Maturation of the receptor in the Golgi appears to involve the dephosphorylation of several residues, perhaps one of which enables the pentamer to exit the Golgi and insert into the plasma membrane. α4 subunits associated with the plasma membrane may be further phosphorylated on Ser550 by PKC, perhaps affecting receptor function or stabilization. β2 subunits can also be phosphorylated by PKA and PKC, but only when are part of the membrane-associated pentamer.

Similar articles

Cited by

References

    1. Almholt K, Arkhammar POG, Thastrup O, Tullin S. Simultaneous visualization of the translocation of protein kinase Cα-green fluorescent protein hybrids and intracellular calcium concentrations. Biochem J. 1999;337:211–218. - PMC - PubMed
    1. Boyle WJ, van der Geer P, Hunter T. Phosphopeptide mapping and phosphoamino acid analysis by two-dimensional separation on thin-layer cellulose plates. Methods Enzymol. 1991;201:110–149. - PubMed
    1. Buisson B, Bertrand D. Chronic exposure to nicotine upregulates the human α4β2 nicotinic acetylcholine receptor function. J Neurosci. 2001;21:1819–1829. - PMC - PubMed
    1. Darsow T, Booker TK, Piña-Crespo JC, Heinemann SF. Exocytotic trafficking is required for nicotine-induced up-regulation of α4β2 nicotinic acetylcholine receptors. J Biol Chem. 2005;280:18311–18320. - PubMed
    1. Eaton JB, Peng JH, Schroeder KM, George AA, Fryer JD, Krishnan C, Buhlman L, Kuo YP, Steinlein O, Lukas RJ. Characterization of human α4β2-nicotinic acetylcholine receptors stably and heterologously expressed in native nicotinic receptor-null SH-EP1 human epithelial cells. Mol Pharmacol. 2003;64:1283–1294. - PubMed

Publication types

MeSH terms