

ProfileGrids as a new visual representation of large multiple sequence alignments: a case study of the RecA protein family
- PMID: 19102758
- PMCID: PMC2663765
- DOI: 10.1186/1471-2105-9-554
ProfileGrids as a new visual representation of large multiple sequence alignments: a case study of the RecA protein family
Abstract
Background: Multiple sequence alignments are a fundamental tool for the comparative analysis of proteins and nucleic acids. However, large data sets are no longer manageable for visualization and investigation using the traditional stacked sequence alignment representation.
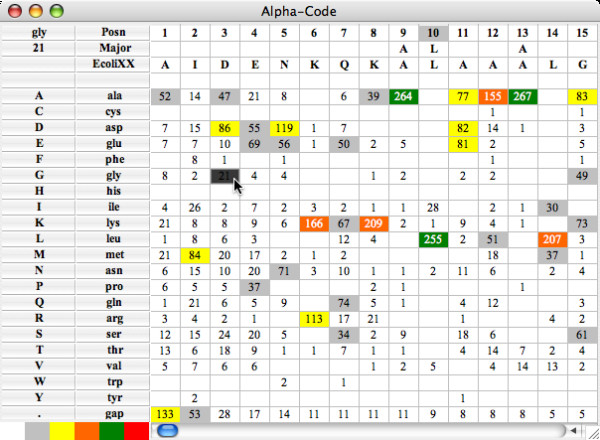
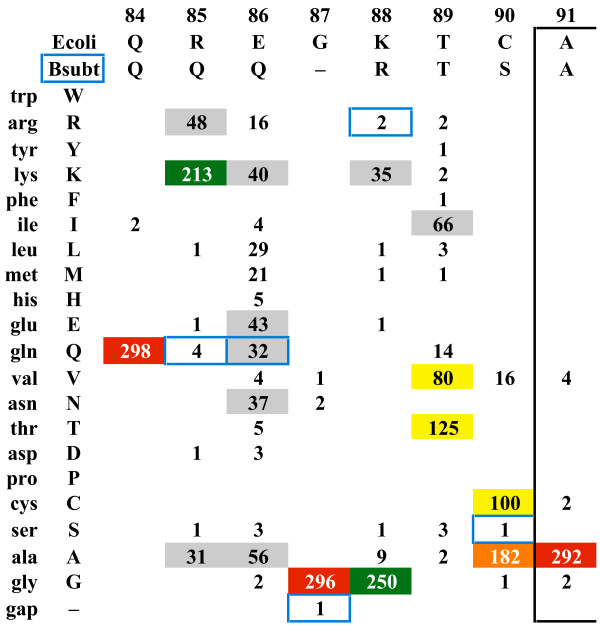
Results: We introduce ProfileGrids that represent a multiple sequence alignment as a matrix color-coded according to the residue frequency occurring at each column position. JProfileGrid is a Java application for computing and analyzing ProfileGrids. A dynamic interaction with the alignment information is achieved by changing the ProfileGrid color scheme, by extracting sequence subsets at selected residues of interest, and by relating alignment information to residue physical properties. Conserved family motifs can be identified by the overlay of similarity plot calculations on a ProfileGrid. Figures suitable for publication can be generated from the saved spreadsheet output of the colored matrices as well as by the export of conservation information for use in the PyMOL molecular visualization program.We demonstrate the utility of ProfileGrids on 300 bacterial homologs of the RecA family - a universally conserved protein involved in DNA recombination and repair. Careful attention was paid to curating the collected RecA sequences since ProfileGrids allow the easy identification of rare residues in an alignment. We relate the RecA alignment sequence conservation to the following three topics: the recently identified DNA binding residues, the unexplored MAW motif, and a unique Bacillus subtilis RecA homolog sequence feature.
Conclusion: ProfileGrids allow large protein families to be visualized more effectively than the traditional stacked sequence alignment form. This new graphical representation facilitates the determination of the sequence conservation at residue positions of interest, enables the examination of structural patterns by using residue physical properties, and permits the display of rare sequence features within the context of an entire alignment. JProfileGrid is free for non-commercial use and is available from http://www.profilegrid.org. Furthermore, we present a curated RecA protein collection that is more diverse than previous data sets; and, therefore, this RecA ProfileGrid is a rich source of information for nanoanatomy analysis.
Figures


Similar articles
-
ProfileGrids: a sequence alignment visualization paradigm that avoids the limitations of Sequence Logos.BMC Proc. 2014 Aug 28;8(Suppl 2 Proceedings of the 3rd Annual Symposium on Biologica):S6. doi: 10.1186/1753-6561-8-S2-S6. eCollection 2014. BMC Proc. 2014. PMID: 25237393 Free PMC article.
-
A symmetric-iterated multiple alignment of protein sequences.J Mol Biol. 1998 Feb 13;276(1):249-64. doi: 10.1006/jmbi.1997.1527. J Mol Biol. 1998. PMID: 9514731
-
Gapped alignment of protein sequence motifs through Monte Carlo optimization of a hidden Markov model.BMC Bioinformatics. 2004 Oct 25;5:157. doi: 10.1186/1471-2105-5-157. BMC Bioinformatics. 2004. PMID: 15504234 Free PMC article.
-
Improving the alignment quality of consistency based aligners with an evaluation function using synonymous protein words.PLoS One. 2011;6(12):e27872. doi: 10.1371/journal.pone.0027872. Epub 2011 Dec 2. PLoS One. 2011. PMID: 22163274 Free PMC article.
-
The bacterial RecA protein and the recombinational DNA repair of stalled replication forks.Annu Rev Biochem. 2002;71:71-100. doi: 10.1146/annurev.biochem.71.083101.133940. Epub 2001 Nov 9. Annu Rev Biochem. 2002. PMID: 12045091 Review.
Cited by
-
IFT88 maintains sensory function by localising signalling proteins along Drosophila cilia.Life Sci Alliance. 2024 Feb 19;7(5):e202302289. doi: 10.26508/lsa.202302289. Print 2024 May. Life Sci Alliance. 2024. PMID: 38373798 Free PMC article.
-
Kingdom-specific lipid unsaturation calibrates sequence evolution in membrane arm subunits of eukaryotic respiratory complexes.Nat Commun. 2025 Feb 27;16(1):2044. doi: 10.1038/s41467-025-57295-7. Nat Commun. 2025. PMID: 40016208 Free PMC article.
-
Argonaute identity defines the length of mature mammalian microRNAs.Nucleic Acids Res. 2012 Aug;40(14):6808-20. doi: 10.1093/nar/gks293. Epub 2012 Apr 13. Nucleic Acids Res. 2012. PMID: 22505576 Free PMC article.
-
ProfileGrids: a sequence alignment visualization paradigm that avoids the limitations of Sequence Logos.BMC Proc. 2014 Aug 28;8(Suppl 2 Proceedings of the 3rd Annual Symposium on Biologica):S6. doi: 10.1186/1753-6561-8-S2-S6. eCollection 2014. BMC Proc. 2014. PMID: 25237393 Free PMC article.
-
Segregating variation in the polycomb group gene cramped alters the effect of temperature on multiple traits.PLoS Genet. 2011 Jan 20;7(1):e1001280. doi: 10.1371/journal.pgen.1001280. PLoS Genet. 2011. PMID: 21283785 Free PMC article.
References
-
- Parry-Smith DJ, Attwood TK. SOMAP: a novel interactive approach to multiple protein sequences alignment. Comput Appl Biosci. 1991;7:233–235. - PubMed
-
- Barton GJ. ALSCRIPT: a tool to format multiple sequence alignments. Protein Eng. 1993;6:37–40. - PubMed
-
- Smith DK, Xue H. A major component approach to presenting consensus sequences. Bioinformatics. 1998;14:151–156. - PubMed
Publication types
MeSH terms
Substances
Grants and funding
LinkOut - more resources
Full Text Sources
Other Literature Sources
