. 2009 Jul 1;390(1):1-13.
doi: 10.1016/j.ab.2008.11.033. Epub 2008 Dec 6.

NUTS and BOLTS: applications of fluorescence-detected sedimentation

Affiliations

NUTS and BOLTS: applications of fluorescence-detected sedimentation

Rachel R Kroe et al. Anal Biochem. .

Abstract

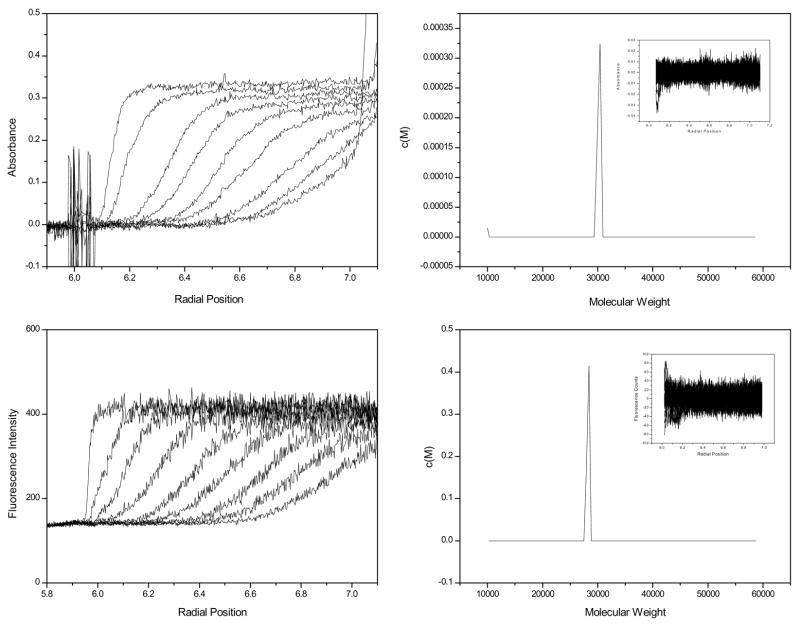
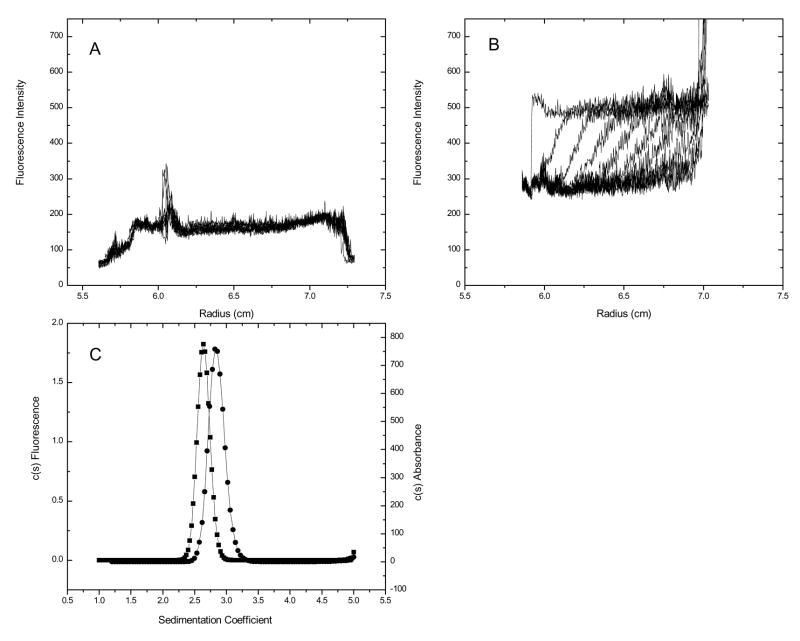
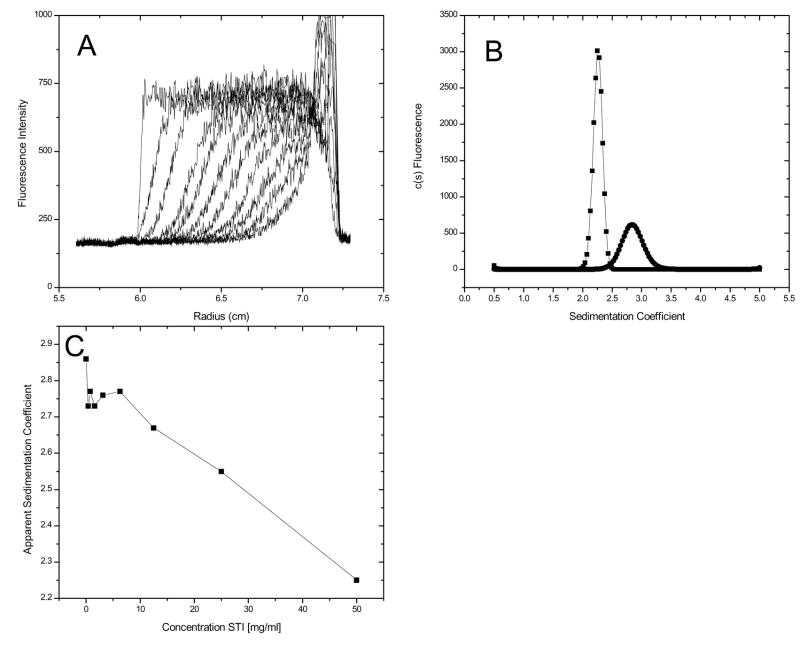
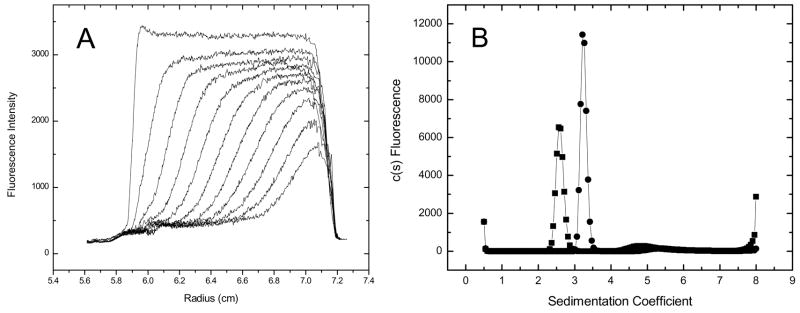
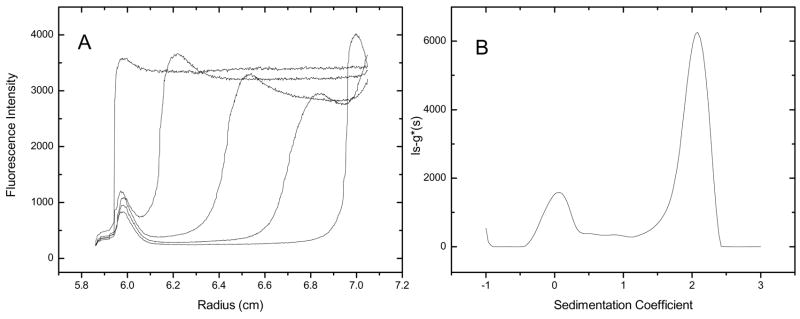
Analytical ultracentrifugation is a widely used method for characterizing the solution behavior of macromolecules. However, the two commonly used detectors, absorbance and interference, impose some fundamental restrictions on the concentrations and complexity of the solutions that can be analyzed. The recent addition of a fluorescence detector for the XL-I analytical ultracentrifuge (AU-FDS) enables two different types of sedimentation experiments. First, the AU-FDS can detect picomolar concentrations of labeled solutes, allowing the characterization of very dilute solutions of macromolecules, applications we call normal use tracer sedimentation (NUTS). The great sensitivity of NUTS analysis allows the characterization of small quantities of materials and high-affinity interactions. Second, the AU-FDS allows characterization of trace quantities of labeled molecules in solutions containing high concentrations and complex mixtures of unlabeled molecules, applications we call biological on-line tracer sedimentation (BOLTS). The discrimination of BOLTS enables the size distribution of a labeled macromolecule to be determined in biological milieus such as cell lysates and serum. Examples that embody features of both NUTS and BOLTS applications are presented along with our observations on these applications.


Figures

Figure 1
Figure 1
Raw absorbance data at 280 nm for 16 μM GFP, one out of every 10 scans is displayed (panel A). c(M) of absorbance data (panel B), 100 scans were used for the c(M) analysis. Raw AU-FDS data for 40 nM GFP (panel C). One out of every 50 scans is displayed. One out of every 5 scans (100 total) were used for the data analysis shown in panel D. c(M) of AU-FDS data (panel D).
Figure 2
Figure 2
Overlay of c(s) plots of GFP:anti-GFP titration (panel A). Antibody was serially diluted 1:3 over a concentration range of 540 nM to 0.003 nM in a constant concentration of 40 nM GFP. Mass fraction of GFP (circles) and anti-GFP/GFP (squares) as a function of antibody concentration (panel B).
Figure 3
Figure 3
Overlay of normalized c(s) plots of 140 nM Alexa488-goat-anti-mouse-IgG (squares), 140 nM Alexa488-goat-anti-mouse-IgG + 130 nM murine IgG (circles) and 14 nM Alexa488-goat-anti-murine IgG + 130 nM murine IgG (triangles).
Figure 4
Figure 4
The concentration dependence of the weight average sedimentation coefficient (sw) for varying concentrations of Alexa488-goat-anti-mouse-IgG in the presence of 133 nM antigen (unlabeled murine IgG). The dashed line shows the sedimentation coefficient for the labeled antibody in the absence of antigen.
Figure 5
Figure 5
Raw AU-FDS data for lipid alone (panel A). One out of every 50 scans are displayed. Raw AU-FDS data for DPPC-NBD in the presence of rsEPCR (panel B). One out of every 50 scans displayed. Overlay of c(s) distribution from absorbance (squares) and AU-FDS optics (circles).
Figure 6
Figure 6
Raw data of GFP in 50 mg ml−1 STI (panel A). One out of every 50 scans are displayed. Overlay of c(s) distributions for GFP in buffer (circles) and in 50 mg ml−1 STI (squares) (panel B). Apparent sedimentation coefficient of GFP as a function of concentration of STI (panel C).
Figure 7
Figure 7
Raw data of GFP sedimenting in E. Coli lysate (panel A). One out of every 50 scans are displayed. Overlay of c(s) distribution of GFP in buffer (squares) and in E. Coli lysate (circles) (panel B)
Figure 8
Figure 8
Overlay of c(s) distribution for Alexa488-BSA in buffer (circles) and in serum (squares) (panel A), overlay of c(s) distribution for Alexa488-goat-anti-rabbit-IgG in buffer (circles) and in serum (triangles) (panel B).
Figure 9
Figure 9
Raw AU-FDS data of 4 μM Fluorescein-DPPE sedimenting in serum (panel A). One out of every 100 scans are displayed.. ls-g*(s) distribution for Fluorescein-DPPE in serum(panel B). 100 scans were used for the ls-g*(s) analysis.
Figure 10
Figure 10
Raw AU-FDS data for GFP sedimenting in serum (panel A). One out of every 100 scans is displayed. c(s) distribution for GFP sedimenting in serum (panel B). Raw AU-FDS data for GFP:anti-GFP sedimenting in serum (panel C). One out of every 100 scans is displayed. c(s) distribution for GFP:anti-GFP sedimenting in serum (panel D). 100 scans were used for each of the c(s) analyses.

References

    1. Cole JL, Lary JW, Moody TP, Laue TM. Analytical Ultracentrifugation: Sedimentation Velocity and Sedimentation Equilibrium. In: Correia JJ, Detrich H, editors. Methods in Cell Biology. Chapter 6. Vol. 84. Elsevier; 2007. pp. 143–179. - PMC - PubMed
    1. Howlett GJ, Minton AP, Rivas G. Analytical ultracentrifugation for the study of protein association and assembly. Curr Opin Chem Biol. 2006;10:430–6. - PubMed
    1. Laue, T.M. “Optical Systems of the XLA Ultracentrifuge” (1996) Applications Data Note for Spinco Division of Beckman Instruments, Inc. P.O.Box 10200, Palo Alto, California.

    1. MacGregor IK, Anderson AL, Laue TM. Fluorescence Detection for the XLI Ultracentrifuge. Biophys Chem. 2004;108:165–185. - PubMed
    1. Laue TM, Austin JB, Rau DA. A Light Intensity Measurement System for the Analytical Ultracentrifuge. Progr Colloid Polym Sci. 2006;131:1–8.

Publication types

LinkOut - more resources