Comparative Study
. 2009 Feb 15;587(Pt 4):769-85.
doi: 10.1113/jphysiol.2008.164111. Epub 2008 Dec 22.

Neuronal oscillations and the rate-to-phase transform: mechanism, model and mutual information

Affiliations
Comparative Study

Neuronal oscillations and the rate-to-phase transform: mechanism, model and mutual information

Douglas McLelland et al. J Physiol. .

Abstract

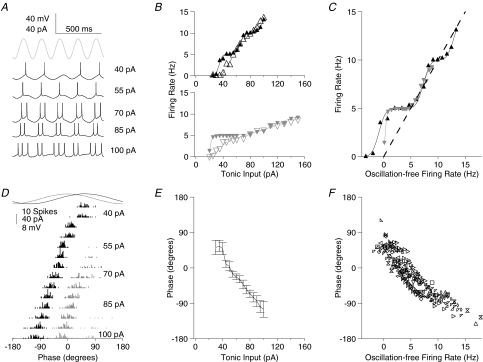
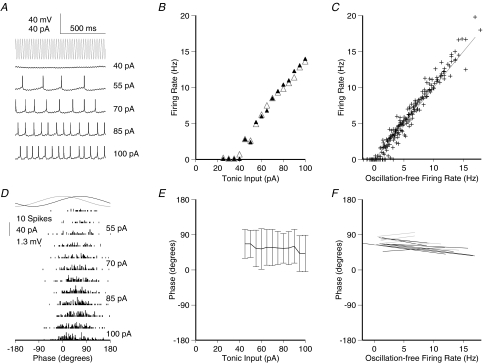
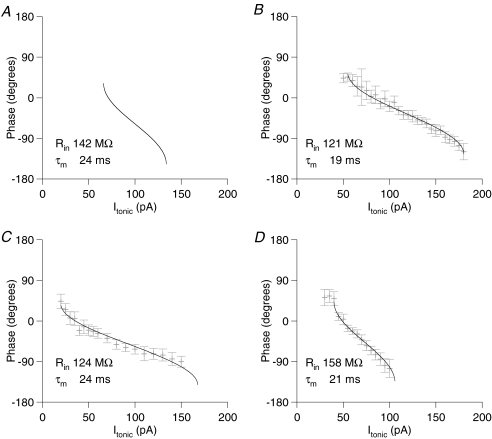
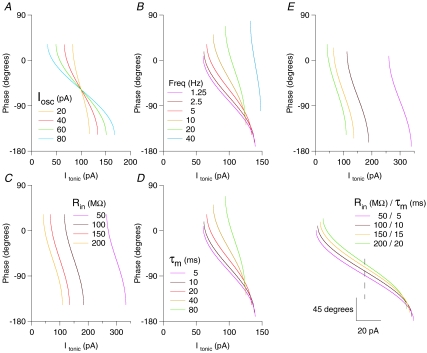
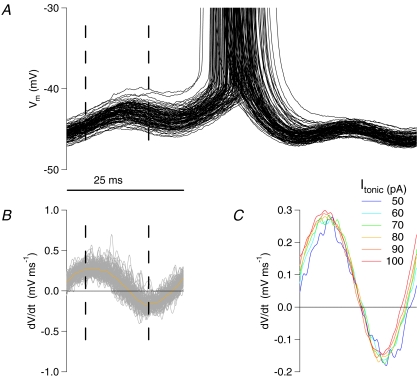
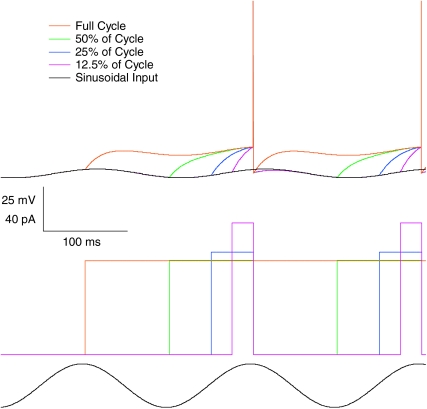
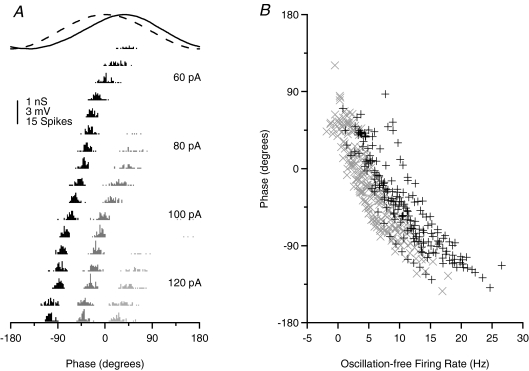
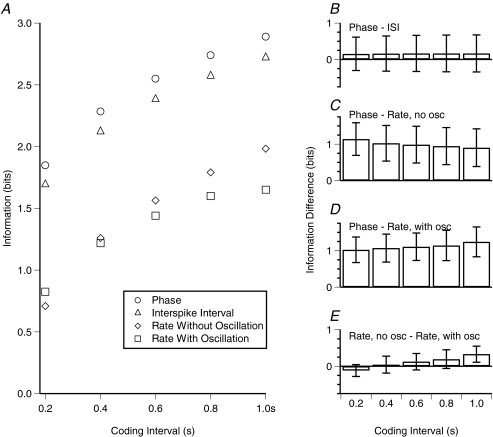
Theoretical and experimental studies suggest that oscillatory modes of processing play an important role in neuronal computations. One well supported idea is that the net excitatory input during oscillations will be reported in the phase of firing, a 'rate-to-phase transform', and that this transform might enable a temporal code. Here, we investigate the efficiency of this code at the level of fundamental single cell computations. We first develop a general framework for the understanding of the rate-to-phase transform as implemented by single neurons. Using whole cell patch-clamp recordings of rat hippocampal pyramidal neurons in vitro, we investigated the relationship between tonic excitation and phase of firing during simulated theta frequency (5 Hz) and gamma frequency (40 Hz) oscillations, over a range of physiological firing rates. During theta frequency oscillations, the phase of the first spike per cycle was a near-linear function of tonic excitation, advancing through a full 180 deg, from the peak to the trough of the oscillation cycle as excitation increased. In contrast, this relationship was not apparent for gamma oscillations, during which the phase of firing was virtually independent of the level of tonic excitatory input within the range of physiological firing rates. We show that a simple analytical model can substantially capture this behaviour, enabling generalization to other oscillatory states and cell types. The capacity of such a transform to encode information is limited by the temporal precision of neuronal activity. Using the data from our whole cell recordings, we calculated the information about the input available in the rate or phase of firing, and found the phase code to be significantly more efficient. Thus, temporal modes of processing can enable neuronal coding to be inherently more efficient, thereby allowing a reduction in processing time or in the number of neurons required.


Figures

Figure 1
Figure 1. Phase of firing relative to theta frequency sinusoidal current is dependent on the level of tonic excitation
A, membrane potential traces for a typical cell receiving a fixed amplitude of theta frequency (5 Hz) sinusoidal current input (trace indicated in grey at the top for comparison of timing) and a range of levels of tonic depolarizing current (indicated to the right of the traces). Spikes are truncated at –20 mV for clarity. B, f–I curve for two typical cells, with (filled symbols and lines) and without (open symbols and dashed lines) sinusoidal theta frequency current. As is apparent in A, firing tends to lock to the oscillatory input, yielding plateaux in the f–I curve at firing rates equal to integer multiples of the oscillation frequency. C, f–I curves for the two cells shown in B, with normalization on the abscissa carried out by converting the tonic current input level to the firing rate induced in the absence of oscillatory input (see Methods). This method of normalization is used throughout for the presentation of pooled data. D, spike time histograms for the same cell as in A, relative to the oscillatory cycle, across the range of tonic input levels tested (first spike per cycle, black; second spike per cycle, dark grey; third spike per cycle, light grey). E, Φ–I curve for the same cell (mean ±s.d.). F, scatter plot of mean firing phase versus oscillation-free firing rate for the population of cells.
Figure 2
Figure 2. Phase of firing relative to gamma frequency sinusoidal current is minimally dependent on the level of tonic excitation for physiological firing rates
A, membrane potential traces for a typical cell (same as shown in Fig. 1A) receiving a fixed amplitude of gamma frequency (40 Hz) sinusoidal current input (trace indicated in grey at the top for comparison of timing) and a range of levels of tonic depolarizing current (indicated to the left of the traces). Spikes are truncated at –20 mV for clarity. B, f–I data for the same cell, with (filled symbols) and without (open symbols) sinusoidal gamma frequency current. The oscillatory component has strikingly little effect on the firing rate. C, f–I data for the population of cells recorded (n= 15), with input normalized across cells as described for Fig. 1C. D, spike time histograms for the same cell as in A, relative to the oscillatory cycle, across the range of tonic input levels tested. There was never more than one spike in any cycle. E, spike phase versus current curve for the same cell (mean ±s.d.). F, linear fits to phase versus oscillation-free firing rate curves for the population of cells. Cells with significant regression slope (P < 0.05) are shown in black, non-significant in grey. Mean slope of phase advance was 0.676 ± 1.51 deg Hz−1, accounting for very little of the variance in spike phase (mean R2= 0.015). The mean standard deviation of firing phase was 47.1 ± 16.8 deg.
Figure 3
Figure 3. Analytically predicted and experimentally measured Φ–I curves
A, the analytically predicted Φ–I curve for a passive point neuron model with basic membrane properties matching the mean of our recorded cells (Rin= 142 MΩ, τm= 24 ms). B–D, Φ–I curves from typical cells, fit by an arccos function, as suggested by the analytical model (phase extent of Φ–I curve fits fixed at 180 deg in keeping with the model, but phase lag and slope of the curve allowed to vary freely). The Rin and τm values reported for each cell were recorded at resting membrane potential. Note that Φ–I curves for the experimentally recorded cells are frequently wider than can be accounted for in the passive model (the upper limit on Φ–I curve width, as τm approaches zero is twice the oscillatory current amplitude, or 80 pA in this case; see text for discussion).
Figure 4
Figure 4. Analytically predicted Φ–I curves for variations in oscillation parameters (amplitude and frequency) and intrinsic cell properties (Rin and τm)
Analytically derived Φ–I curves for a passive point neuron model with the following parameters, except where otherwise stated: Rin= 150 MΩ, τm= 20 ms, Iosc= 40 pA, oscillation frequency = 5 Hz (these default values shown by the red traces). A, increasing oscillation amplitude leads to horizontal stretch of the f–I curve, symmetrical about its midpoint. B, increasing oscillation frequency leads to an upward and rightward shift of the Φ–I curve, along with an increase in its slope. C, decreasing Rin leads to a rightward shift of the Φ–I curve, with no effect on curve slope or phase lag. D, changing τm has an effect identical to proportional changes in oscillation frequency. E, parallel changes in Rin and τm (as seen with, e.g. a change in net synaptic drive to a cell) yield a simple combination of the effects of independent changes in Rin and τm. Specifically, increased τm and Rin yields a left shift of the curve, with increased phase lag and an increase in slope. In the lower panel of E, Φ–I curves have been horizontally aligned by the midpoint (dashed line), emphasizing that substantial changes in conductance state of the cell could yield surprisingly small changes in the shape of Φ–I curve (dependent on specific parameters; see text for details).
Figure 5
Figure 5. Peri-threshold membrane potential behaviour during gamma frequency input
A, peri-spike membrane potential traces for a cell receiving a fixed level of tonic input (80 pA) and fixed amplitude sinusoidal oscillatory input at gamma frequency (40 pA, 40 Hz), aligned by oscillation phase. Dashed lines in the cycle preceding the spikes indicate the phase range over which spikes occurred. Note that, in the cycle preceding the spike, there is always a downwards trend in membrane potential late in the cycle. The implication is that, if the cell has not spiked by a certain point in the cycle, the trough of the oscillatory input is sufficient to overcome the cell's intrinsic inward currents and postpone spiking to the next gamma cycle. B, the first derivative of the above traces (mean shown in orange) emphasizes the negative slope of the membrane potential for part of the cycle preceding spiking. C, mean of membrane potential first derivatives (as in B) for different levels of tonic input. With regard to the phase at which positive membrane potential slope resumes late in the cycle, note that this advances systematically with increasing tonic input. As reflected in the Φ–I curves for gamma frequency input, however, this advance is slight compared with the overall variance in spike phase.
Figure 6
Figure 6. Excitatory current step duration and amplitude trade-off for fixed spike phase
Output from a numerically simulated single compartment integrate-and-fire model (lower traces show the tonic and oscillatory current inputs, upper traces show the resulting membrane potential). With shortening of the excitatory current step duration, spike phase can be maintained by modest increases in step amplitude. For the physiologically relevant parameters tested here (5 Hz oscillation, τm 20 ms), reducing step duration to only 50% of the oscillation cycle necessitates only a 0.67% increase in step amplitude, and even for a step duration of 12.5% of the cycle, a 40% increase in step amplitude compensates.
Figure 7
Figure 7. Cell response to oscillatory conductance injection, via dynamic clamp, does not differ significantly from oscillatory current injection
A, spike phase histograms for a typical cell receiving a theta frequency (5 Hz) sinusoidally modulated inhibitory conductance (implemented via dynamic clamp) and a range of levels of tonic current input. First spike per cycle are indicated in black, second in dark grey, and third in light grey. The conductance input (dashed line) and subthreshold membrane potential response (continuous line) are also indicated. Note that, because it is inhibitory, the conductance trace is inverted for clarity of presentation. B, comparison of Φ–I scatter plots for current based (grey) and conductance based (black) oscillatory input. Apart from a horizontal shift due to the mean inhibitory component of the oscillatory conductance, no qualitative difference in behaviour is revealed.
Figure 8
Figure 8. For CA1 pyramidal cells encoding tonic input level, temporal codes are more information efficient than rate codes
A, mean mutual information across cells (those tested in dynamic clamp mode, n= 14), between Itonic and each of the spike output parameters (phase, ISI or rate), as a function of the coding interval (time period for examination of the spike output). Error bars are not indicated because a major source of variance across cells was the stimulus range over which information was estimated. B–E, differences in information estimated for each of the spike output parameters (mean and standard deviation of individual cell differences). Information difference values are not sensitive to the stimulus range over which they are estimated (given equally efficient coding across all relevant stimulus levels, which we found to be nearly the case), and so error bars are included for panels B–E. Temporal codes (phase and ISI) were not significantly different from each other (P > 0.05) but were both significantly more efficient than rate codes (P < 0.001).

Similar articles

Cited by

References

    1. Adrian E. The impulses produced by sensory nerve endings: Part I. J Physiol. 1926;61:49–72. - PMC - PubMed
    1. Borst A, Theunissen FE. Information theory and neural coding. Nat Neurosci. 1999;2:947–957. - PubMed
    1. Brody CD, Hopfield JJ. Simple networks for spike-timing-based computation, with application to olfactory processing. Neuron. 2003;37:843–852. - PubMed
    1. Bryant HL, Segundo JP. Spike initiation by transmembrane current – white-noise analysis. J Physiol. 1976;260:279–314. - PMC - PubMed
    1. Burgess N, Barry C, O'Keefe J. An oscillatory interference model of grid cell firing. Hippocampus. 2007;17:801–812. - PMC - PubMed

Publication types