. 2008 Dec 29;183(7):1223-33.
doi: 10.1083/jcb.200809190. Epub 2008 Dec 22.

CLIP-170 tracks growing microtubule ends by dynamically recognizing composite EB1/tubulin-binding sites

Affiliations

CLIP-170 tracks growing microtubule ends by dynamically recognizing composite EB1/tubulin-binding sites

Peter Bieling et al. J Cell Biol. .

Abstract

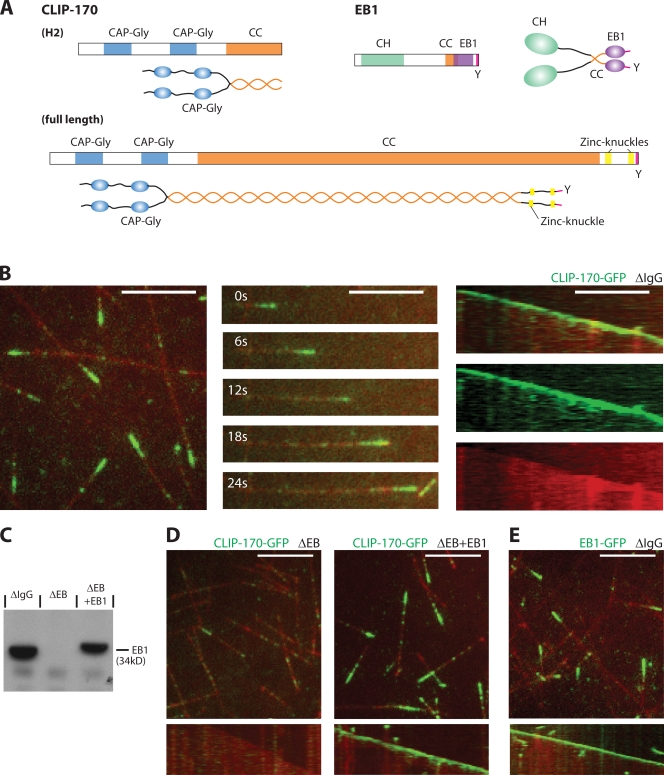
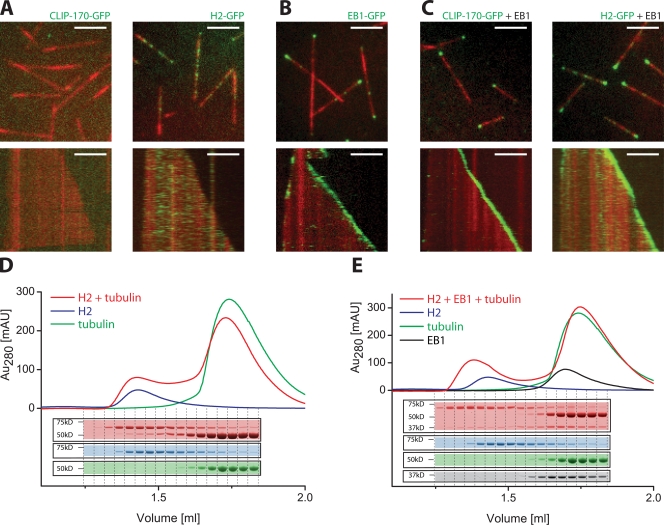
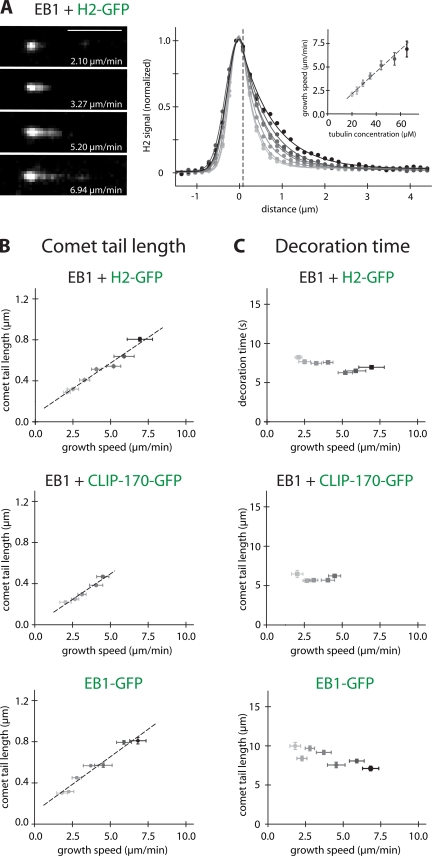
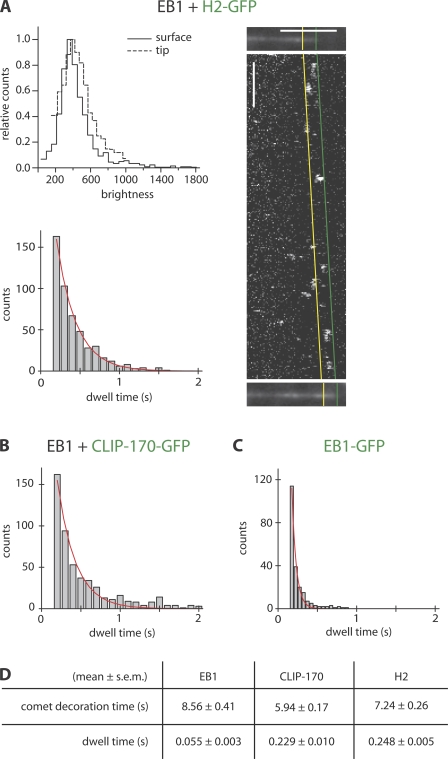
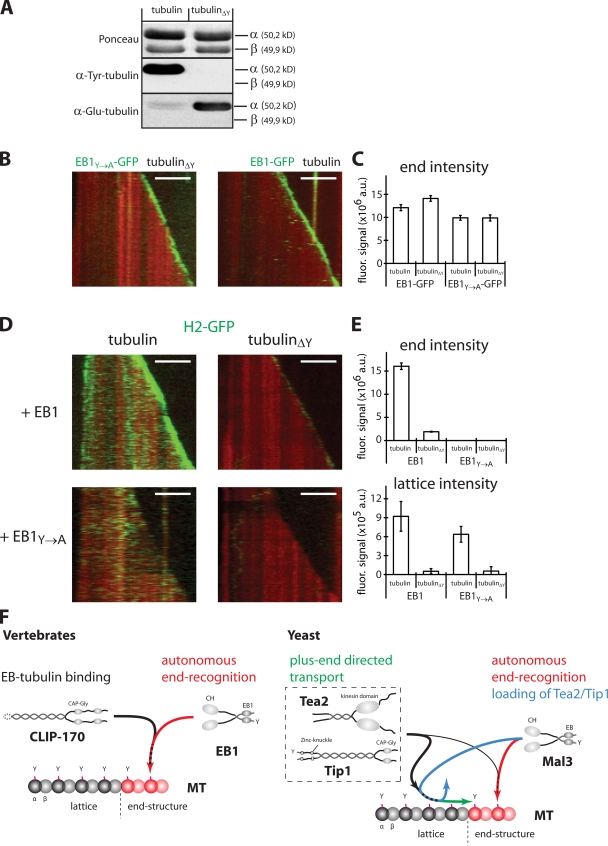
The microtubule cytoskeleton is crucial for the internal organization of eukaryotic cells. Several microtubule-associated proteins link microtubules to subcellular structures. A subclass of these proteins, the plus end-binding proteins (+TIPs), selectively binds to the growing plus ends of microtubules. Here, we reconstitute a vertebrate plus end tracking system composed of the most prominent +TIPs, end-binding protein 1 (EB1) and CLIP-170, in vitro and dissect their end-tracking mechanism. We find that EB1 autonomously recognizes specific binding sites present at growing microtubule ends. In contrast, CLIP-170 does not end-track by itself but requires EB1. CLIP-170 recognizes and turns over rapidly on composite binding sites constituted by end-accumulated EB1 and tyrosinated alpha-tubulin. In contrast to its fission yeast orthologue Tip1, dynamic end tracking of CLIP-170 does not require the activity of a molecular motor. Our results demonstrate evolutionary diversity of the plus end recognition mechanism of CLIP-170 family members, whereas the autonomous end-tracking mechanism of EB family members is conserved.


Figures

Figure 1.
Figure 1.
CLIP-170 tracks growing microtubule ends in X. laevis egg extract in an EB1-dependent manner. (A) Scheme of the domain architecture of CLIP-170 and EB1. (B) TIRF microscopy of CLIP-170–GFP (green) on dynamic Alexa Fluor 568–labeled microtubules (red) in mock-depleted interphasic egg extract: an image of several microtubules (left), a time sequence (middle), and the corresponding kymograph (space-time plot) as overlay and separate channels (right) of a single microtubule are shown. (C) Western blot of mock-depleted (ΔIgG), EB-depleted (ΔEB), and EB-depleted extract with added recombinant EB1 (ΔEB+EB1), probed with an anti-EB1 antibody. (D) Images (top) and kymographs (bottom) of CLIP-170–GFP and dynamic microtubules in EB-depleted interphasic extract (left) and in extract with added recombinant EB1 (right). (E) Image (top) and kymograph (bottom) of EB1-GFP and microtubules in mock-depleted extract. Recombinant CLIP-170–GFP or EB1-GFP was added to a final concentration of 125 nM. Kymographs display a period of 46 s. Bars, 5 μm.
Figure 2.
Figure 2.
EB1 is necessary and sufficient for end tracking of CLIP-170 in buffer. (A–C) TIRF microscopy images (top) and kymographs (bottom) of dynamic Alexa Fluor 568–labeled microtubules (red) in buffer in the presence of the following purified GFP-labeled +TIPs (green): 50 nM CLIP-170–GFP (A, left) or 50 nM H2-GFP (A, right); 150 nM EB1-GFP (B); and 35 nM CLIP-170–GFP (C, left) or 35 nM H2-GFP (C, right) in the presence of 70 nM of unlabeled EB1 in the presence of 15.5 μM tubulin. Kymographs display a period of 5 min. Bars, 5 μm. (D and E) Analytical gel filtrations: UV absorbance profiles and the corresponding Coomassie-stained SDS gel fractions of runs of a mixture of 20 nM H2 and 40 nM GTP-tubulin (D, red), and of 20 nM H2, 20 nM EB1, and 40 nM GTP-tubulin (E, red). Runs of H2 alone (blue), GTP-tubulin alone (green), and EB1 alone (black) at concentrations as in the mixtures are shown for comparison.
Figure 3.
Figure 3.
Analysis of the comet-shaped accumulation of +TIPs at microtubule ends. (A, left) TIRF microscopy images of comet-like accumulations of H2-GFP (added at 75 nM) at the ends of individual microtubules growing with the indicated velocities in the presence of 150 nM of unlabeled EB1. Bar, 5 μm. (A, right) Averaged fluorescence intensity profiles of H2-GFP comets at different tubulin concentrations (from 50 individual comets per tubulin concentration; dots) were fitted (lines) using Gaussian (to the left of the vertical broken line) and single exponential (to the right of the vertical broken line) functions. (A, inset) Microtubule growth velocities as a function of the used tubulin concentrations (error bars indicate SD). (B) Comet tail lengths of H2-GFP (top) and CLIP-170–GFP (middle) in the presence of unlabeled EB1, and of EB1-GFP alone (bottom) as a function of the microtubule growth speed. The comet tail lengths were obtained from the single exponential fits to the averaged intensity profiles. H2-GFP and CLIP-170–GFP were added at 75 nM, and EB1 and EB1-GFP at 150 nM. (C) Characteristic end-decoration times of the +TIPs as indicated corresponding to the comet tail lengths in B. The characteristic decoration time in the comet tail was obtained by dividing the comet tail length by the microtubule growth speed. Vertical error bars in B and C represent the standard error, and horizontal error bars represent the SD of the growth velocity.
Figure 4.
Figure 4.
Single-molecule imaging: fast turnover of CLIP-170 and EB1 at growing microtubule ends. (A, top left) Brightness distribution of the fluorescence of single H2-GFP molecules as measured when attached to a surface and bound to the growing microtubule end, as indicated. The uniformity of the distributions and their similarity indicates that the large majority of the observed H2-GFP molecules at microtubule ends are individual dimers (see also Fig. S3, available at http://www.jcb.org/cgi/content/full/jcb.200809190/DC1). (A, right) Individual H2-GFP molecules (added at 1 nM) binding at growing microtubule ends in the presence of an excess 74 nM of unlabeled H2, 150 nM of unlabeled EB1, and 35 μM tubulin. Images of a growing Alexa Fluor 568–labeled microtubule directly before (top) and after (bottom) a fast H2-GFP time lapse (shown as a kymograph between the microtubule images) were used to identify the growth trajectory of the microtubule end region. Binding events within the end region reaching from the distal end of the microtubule (green) to the end of the comet tail (yellow) as obtained from the averaged intensity profile (Fig. 4 A, right) were analyzed. Horizontal bar, 5 μm; vertical bar, 2 s. (A, bottom left) Histogram of the dwell times of end-associated single H2-GFP molecules. (B) Histogram of single CLIP-170–GFP molecules added at 5 nM in the presence of 70 nM of unlabeled CLIP-170, 150 nM of unlabeled EB1, and 35 μM tubulin. (C) Histogram of single EB1-GFP molecules added at 0.75 nM in the presence of 149 nM of unlabeled EB1 and 35 μM tubulin. Red lines in the histograms are single exponential fits to the data, providing a mean (single molecule) dwell time for each +TIP that is approximately two orders of magnitude lower than the mean bleaching time of the fluorescent label (Fig. S3). (D) Summary of the mean +TIP comet decoration times as determined from data shown in Fig. 3 C and the mean single molecule dwell times from histogram fits. Comet decoration times are significantly different (Mann-Whitney U test, P < 0.05), even if in a similar range. Dwell times differ from comet decoration times by more than an order of magnitude.
Figure 5.
Figure 5.
CLIP-170 recognizes composite EB1/tubulin-binding sites at the microtubule end. (A) Western blot of mock-treated and detyrosinated tubulin (tubulinΔY) either Ponceau-stained or probed with an anti–Tyr-tubulin or anti–Glu-tubulin antibody. (B) Kymographs of a growing TAMRA-labeled microtubule (red) in the presence of 75 nM EB1Y→A-GFP (left, green) or EB1-GFP (right, green) in buffer. (C) The peak signal of the EB1 comets obtained from averaged intensity profiles at the indicated conditions. Error bars indicate standard error.(D) Kymographs of a growing TAMRA-labeled microtubule (red) in the presence of 35 nM H2-GFP (green) growing with either mock-treated (left) or detyrosinated tubulin (right) in the presence of unlabeled EB1 (top) or EB1Y→A (bottom). Bars, 5 μm. (E) The peak signal of the H2 comets (top) obtained from averaged intensity profiles at the indicated conditions. Signal of H2-GFP bound to the microtubule lattice (bottom) as averaged from intensity line scans. Error bars indicate the standard error (top) or the standard deviation of the mean lattice intensity from the line scans (bottom). (F) Schematic illustration of the mechanisms of end tracking by vertebrate (left) and fission yeast (right) +TIPs. See text for details.

Comment in

References

    1. Akhmanova, A., and M.O. Steinmetz. 2008. Tracking the ends: a dynamic protein network controls the fate of microtubule tips. Nat. Rev. Mol. Cell Biol. 9:309–322. - PubMed
    1. Arnal, I., C. Heichette, G.S. Diamantopoulos, and D. Chretien. 2004. CLIP-170/tubulin-curved oligomers coassemble at microtubule ends and promote rescues. Curr. Biol. 14:2086–2095. - PubMed
    1. Badin-Larcon, A.C., C. Boscheron, J.M. Soleilhac, M. Piel, C. Mann, E. Denarier, A. Fourest-Lieuvin, L. Lafanechere, M. Bornens, and D. Job. 2004. Suppression of nuclear oscillations in Saccharomyces cerevisiae expressing Glu tubulin. Proc. Natl. Acad. Sci. USA. 101:5577–5582. - PMC - PubMed
    1. Bieling, P., L. Laan, H. Schek, E.L. Munteanu, L. Sandblad, M. Dogterom, D. Brunner, and T. Surrey. 2007. Reconstitution of a microtubule plus-end tracking system in vitro. Nature. 450:1100–1105. - PubMed
    1. Busch, K.E., J. Hayles, P. Nurse, and D. Brunner. 2004. Tea2p kinesin is involved in spatial microtubule organization by transporting tip1p on microtubules. Dev. Cell. 6:831–843. - PubMed

Publication types