. 2009 Jan 6;119(1):89-98.
doi: 10.1161/CIRCULATIONAHA.108.803999. Epub 2008 Dec 22.

Myocardial adeno-associated virus serotype 6-betaARKct gene therapy improves cardiac function and normalizes the neurohormonal axis in chronic heart failure

Affiliations

Myocardial adeno-associated virus serotype 6-betaARKct gene therapy improves cardiac function and normalizes the neurohormonal axis in chronic heart failure

Giuseppe Rengo et al. Circulation. .

Abstract

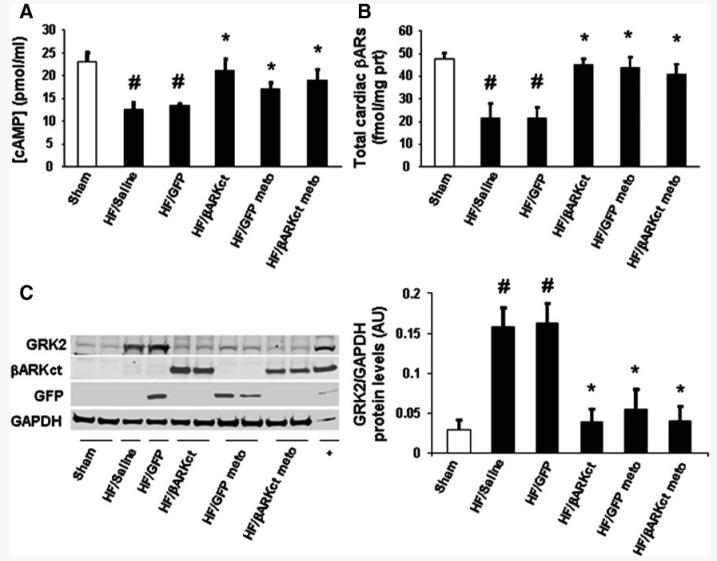
Background: The upregulation of G protein-coupled receptor kinase 2 in failing myocardium appears to contribute to dysfunctional beta-adrenergic receptor (betaAR) signaling and cardiac function. The peptide betaARKct, which can inhibit the activation of G protein-coupled receptor kinase 2 and improve betaAR signaling, has been shown in transgenic models and short-term gene transfer experiments to rescue heart failure (HF). This study was designed to evaluate long-term betaARKct expression in HF with the use of stable myocardial gene delivery with adeno-associated virus serotype 6 (AAV6).

Methods and results: In HF rats, we delivered betaARKct or green fluorescent protein as a control via AAV6-mediated direct intramyocardial injection. We also treated groups with concurrent administration of the beta-blocker metoprolol. We found robust and long-term transgene expression in the left ventricle at least 12 weeks after delivery. betaARKct significantly improved cardiac contractility and reversed left ventricular remodeling, which was accompanied by a normalization of the neurohormonal (catecholamines and aldosterone) status of the chronic HF animals, including normalization of cardiac betaAR signaling. Addition of metoprolol neither enhanced nor decreased betaARKct-mediated beneficial effects, although metoprolol alone, despite not improving contractility, prevented further deterioration of the left ventricle.

Conclusions: Long-term cardiac AAV6-betaARKct gene therapy in HF results in sustained improvement of global cardiac function and reversal of remodeling at least in part as a result of a normalization of the neurohormonal signaling axis. In addition, betaARKct alone improves outcomes more than a beta-blocker alone, whereas both treatments are compatible. These findings show that betaARKct gene therapy can be of long-term therapeutic value in HF.


Figures

Figure 1
Figure 1
A, Overall design of the 24-week study. Representative Western blot analysis of βARKct (B) and GFP (C) protein expression in rat tissues 12 weeks after intramyocardial delivery with AAV6/βARKct and AAV6/GFP, respectively. RV indicates right ventricle; SKM, skeletal muscle; +, positive controls. D, Representative GFP fluorescence microscopy (left), light microscopy (middle), and overlay of both (right) of LV myocardium 12 weeks after intramyocardial rAAV6-GFP delivery. Magnification ×4. Bar=0.5 mm.
Figure 2
Figure 2
EF as measured by echocardiography 12 weeks after MI (A) and 12 weeks after in vivo rAAV6-βARKct gene delivery (B) with or without metoprolol (meto) treatment (and 24 weeks after MI). C, Percentage change in alteration of EF after the 12 weeks of treatment. LV internal diameter at diastole (LVIDd) measured by echocardiography 12 weeks after MI (D) and after 12 weeks of treatment (E) is shown. F, Heart rate (HR) at 24 weeks after MI. G, Representative raw tracings of M-mode echocardiography 12 weeks after gene delivery. Sham, n=11; HF/saline, n=14; HF/GFP, n=11; HF/βARKct, n=12; HF/GFP-metoprolol (Meto), n=11; and HF/βARKct-metoprolol, n=11. Data are presented as mean±SEM. Bar=8 mm. ^P<0.05 vs HF/saline, HF/GFP, or HF/GFP-metoprolol groups; #P<0.05 vs sham; *P<0.05 vs HF/saline or HF/GFP groups; &P<0.05 vs each non-metoprolol-treated group; ANOVA analysis and Bonferroni test among all groups.
Figure 3
Figure 3
A, Representative raw tracings of LV dP/dt values 24 weeks after MI in all 6 experimental groups. B, Average LV +dP/dt and LV −dP/dt values (C) in the 6 experimental groups (sham, n=11; HF/saline, n=13; HF/GFP, n=12; HF/βARKct, n=12; HF/GFP-metoprolol (meto), n=13; and HF/βARKct-metoprolol, n=12) evaluated under basal conditions and after maximal isoproterenol stimulation. ANOVA analysis and Bonferroni test were used among all groups. Data are presented as mean±SEM. #P<0.05 vs sham at basal; †P<0.05 vs sham after maximal isoproterenol stimulation; ^P<0.05 vs HF/saline, HF/GFP, or HF/GFP-metoprolol groups at basal; §P<0.05 vs HF/saline, HF/GFP, or HF/GFP-metoprolol groups after maximal isoproterenol stimulation.
Figure 4
Figure 4
A, Average steady state cAMP production and total βAR density (B) in cardiac homogenates purified from hearts of all 6 experimental groups at 24 weeks after MI (n=6 for each group). Representative Western blot (C, left panel) and average densitometric quantitative analysis (C, right panel) from blots showing the ratio of GRK2 to GAPDH and expression of βARKct or GFP transgenes in LV homogenates (n=8 for each group). meto indicates metoprolol. Data are presented as mean±SEM. *P<0.05 vs HF/saline or HF/GFP groups; #P<0.05 vs sham; ANOVA analysis and Bonferroni test among all groups.
Figure 5
Figure 5
Heart mRNA levels of collagen I (Col1) (A); transforming growth factor β1 (TGFβ1) (B); atrial natriuretic factor (ANF) (C) in all experimental groups at 24 weeks after MI; and BNP (D). All values were standardized to amplified 28S rRNA. Data are presented as mean±SEM and plotted as fold over sham values. *P<0.05 vs HF/saline or HF/GFP groups; #P<0.05 vs sham; ^P<0.05 vs HF/saline, HF/GFP, or HF/GFP-metoprolol groups; ANOVA analysis and Bonferroni test among all groups.
Figure 6
Figure 6
Plasma norepinephrine (A), plasma epinephrine (B), and plasma aldosterone (C) levels in the 6 groups at 24 weeks after MI. Data are presented as mean±SEM. *P<0.05 vs HF/saline or HF/GFP groups; #P<0.05 vs sham; ANOVA analysis and Bonferroni test among all groups.

Similar articles

Cited by

References

    1. Levy D, Kenchaiah S, Larson MG, Benjamin EJ, Kupka MJ, Ho KK, Murabito JM, Vasan RS. Long-term trends in the incidence of and survival with heart failure. N Engl J Med. 2002;347:1397–1402. - PubMed
    1. Harnad E, Mather PJ, Srinivasan S, Rubin S, Whellan DJ, Feldman AM. Pharmacologic therapy of chronic heart failure. Am J Cardiovasc Drugs. 2007;7:235–248. - PubMed
    1. Vinge LE, Raake PW, Koch WJ. Gene therapy in heart failure. Circ Res. 2008;102:1458–1470. - PMC - PubMed
    1. Rockman HA, Koch WJ, Lefkowitz RJ. Seven-transmembrane-spanning receptors and heart function. Nature. 2002;415:206–212. - PubMed
    1. Pierce KL, Premont RT, Lefkowitz RJ. Seven-transmembrane receptors. Nat Rev Mol Cell Biol. 2002;3:639–650. - PubMed

Publication types

MeSH terms