. 2008 Dec 30;105(52):20583-8.
doi: 10.1073/pnas.0805017105. Epub 2008 Dec 22.

Explosively launched spores of ascomycete fungi have drag-minimizing shapes

Affiliations

Explosively launched spores of ascomycete fungi have drag-minimizing shapes

Marcus Roper et al. Proc Natl Acad Sci U S A. .

Abstract

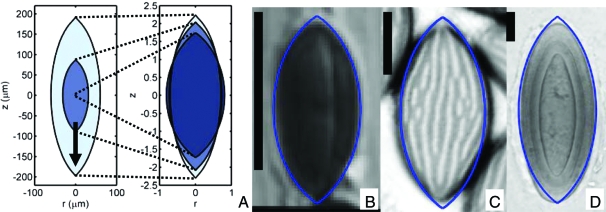
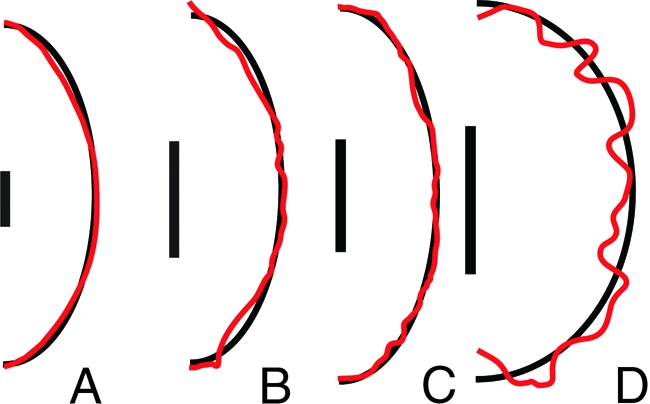
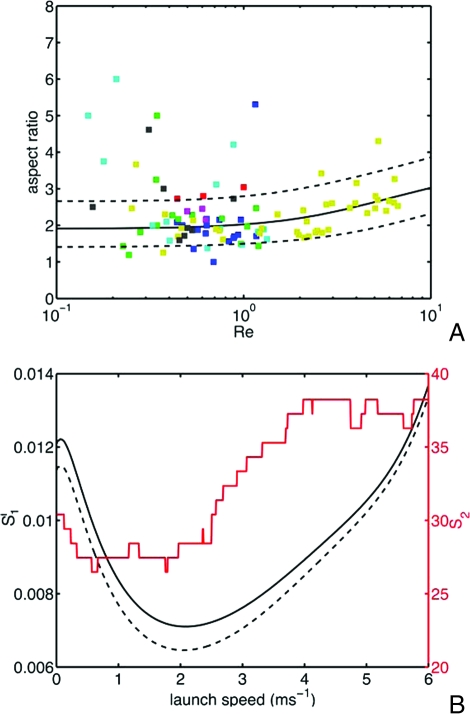
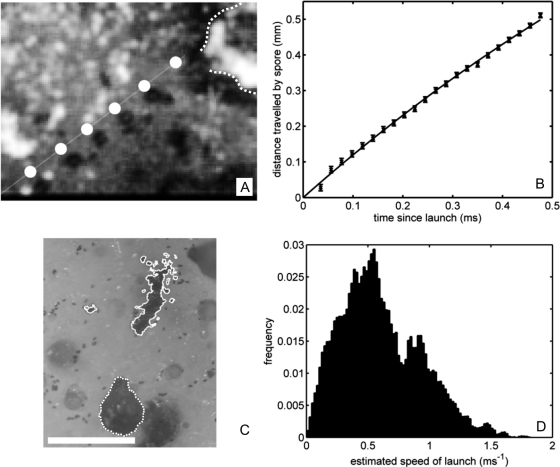
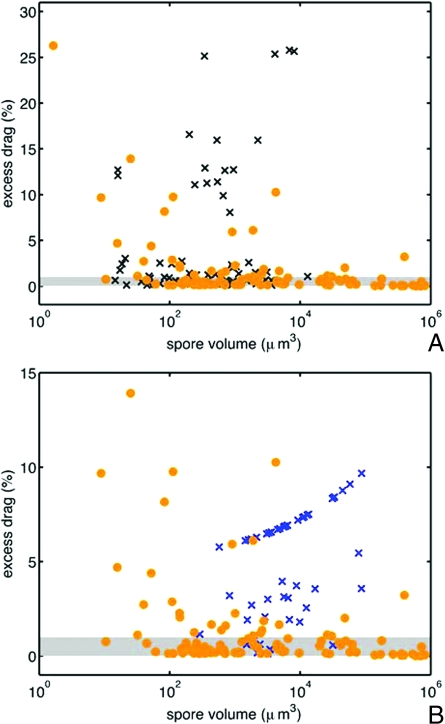
The forcibly launched spores of ascomycete fungi must eject through several millimeters of nearly still air surrounding fruiting bodies to reach dispersive air flows. Because of their microscopic size, spores experience great fluid drag, and although this drag can aid transport by slowing sedimentation out of dispersive air flows, it also causes spores to decelerate rapidly after launch. We hypothesize that spores are shaped to maximize their range in the nearly still air surrounding fruiting bodies. To test this hypothesis we numerically calculate optimal spore shapes-shapes of minimum drag for prescribed volumes-and compare these shapes with real spore shapes taken from a phylogeny of >100 species. Our analysis shows that spores are constrained to remain within 1% of the minimum possible drag for their size. From the spore shapes we predict the speed of spore launch, and confirm this prediction through high-speed imaging of ejection in Neurospora tetrasperma. By reconstructing the evolutionary history of spore shapes within a single ascomycete family we measure the relative contributions of drag minimization and other shape determinants to spore shape evolution. Our study uses biomechanical optimization as an organizing principle for explaining shape in a mega-diverse group of species and provides a framework for future measurements of the forces of selection toward physical optima.


Conflict of interest statement

The authors declare no conflict of interest.

Figures

Fig. 1.
Fig. 1.
Real and drag-minimizing spore shapes. (A) Minimal drag shapes for Re = 0.1 (darkest), 1, 10 (lightest). The arrow points in the direction of flight and spores are axisymmetric about this direction. (Left) Spore dimensions are given in physical units (assuming U0 = 2.1 m·s−1). (Right) All spores are scaled to have equal volumes. The near fore-aft symmetry is not imposed (20). Comparison of minimal-drag shapes with Astrocystis cepiformis (B), N. crassa (C), Pertusaria islandica (D) spores. (Scale bar: 10 μm.) Like surface ornamentations (Fig. 2 and Table 1), rounding of spore apices only mildly increases drag. [B, reproduced with permission from ref. (copyright 1998, British Mycological Society); C, reprinted from Experimental Mycology Vol 14, Glass NL, Metzenberg RL, Raju NB, Homothallic Sordariaceae from nature: The absence of strains containing only the a mating type sequence, 16 pp, 2008, with permission from Elsevier; D, reproduced with permission from ref. 39 (copyright 2006, British Lichen Society).
Fig. 2.
Fig. 2.
Silhouettes of highly rugose spores (red curves), traced from optical or electron micrographs and approximating ellipsoids (black curves) constructed to have the same volume and aspect ratio for N. crassa (A), A. aurantia (B), P. baddia (C), and P. vacinii (D). (Scale bar: 5 μm.) Although the approximating ellipsoids do not precisely capture the shape of the spore, they well-approximate the drag on the spore (see Table 1).
Fig. 3.
Fig. 3.
Forcibly ejected spore shapes across a phylogeny of 102 species. (A) Comparison of optimal shapes with real spores. Spore aspect ratio (length divided by width) is plotted against Reynolds number. Each point represents the average aspect ratio and size for a single species, color-coded by phylogenetic (sub)class. The black curve displays the optimal aspect ratio; species between the two dotted curves are within 1% of the minimum drag. Key to symbols: (blue) Pezizomycetes, (green) (Sordariomycetes) Sordariomycetidae, (red) (Dothideomycetes) Dothideomycetidae, (aqua) Leotiomycetes, (magenta) Eurotiomycetes, (yellow) (Lecanoromycetes) Ostropomycetidae, (black) (Lecanoromycetes) Lecanoromycetidae. (B) Inference of U0, using two measures of quality of fit. S1 (black curves, left axis) gives the sum of squared differences between optimal and real spore aspect ratios, averaged over bins in volumetric radius, and then between bins (the solid curve corresponds to bins of width 10 μm, and the dashed curve to bins of width 5 μm) and S2 (red curve, right axis) is the per cent fraction of species whose drag exceeds the minimum possible by > 1%. Both fits are consistent with a launch speed in the range 1-3.5 m·s−1. The optimal aspect ratio in A is obtained by using a consensus value from multiple quality-of-fit measures: U0 = 2.1 m·s−1.
Fig. 4.
Fig. 4.
Experimental determination of spore ejection speed in N. tetrasperma. (A) Composite image of the flight of a N. tetrasperma spore at 63-μs intervals, including (slightly displaced) trajectory predicted from Eq. 2. The dotted curve shows the outline of originating perithecium. (B) Fit of spore trajectory (points) to Eq. 2; giving launch speed U0 = 1.24 m·s−1. (C) Spore piles (outlined by solid curves) surrounding the perithecium (dotted curve). (Scale bar: 0.5 mm.) (D) Inferred launch speeds from spore prints of N = 100 fruiting bodies.
Fig. 5.
Fig. 5.
Ejected and nonejected spores. (A) Comparison of excess drag—the difference in drag between the real spore shape and the optimal shape of the same size—on logarithmic axes for forcibly ejected spores (·) and (×) insect-dispersed Sordariomycete spores. (B) Comparison of excess drag for forcibly ejected spores and hypogeous Pezizomycete spores (×). Species within the shaded region have drag-to-mass ratios within 1% of the optimal value. More than 75% of forcibly ejected spores, but <45% of insect dispersed spores and 16% of hypogeous spores have excess drag values below this bound. The axes have been rescaled in B, removing the ejected species G. platystroma from the plot window.

References

    1. Vogel S. Life in Moving Fluids: The Physical Biology of Flow. 2nd Ed. Princeton: Princeton Univ Press; 1994.
    1. Parkhurst D, Loucks O. Optimal leaf size in relation to environment. J Ecol. 1972;60:505–537.
    1. Taylor GK, Nudds RL, Thomas ALR. Flying and swimming animals cruise at a Strouhal number tuned for high power efficiency. Nature. 2003;425:707–711. - PubMed
    1. Pyke G, Pulliam H, Charnov E. Optimal foraging: A selective review of theory and tests. Q Rev Biol. 1977;52:137–154.
    1. Gilchrist M, Sulsky D, Pringle A. Identifying fitness and optimal life-history strategies for an asexual filamentous fungus. Evolution. 2006;60:970–979. - PubMed

Publication types