. 2008 Dec 30;105(52):20870-5.
doi: 10.1073/pnas.0810772105. Epub 2008 Dec 22.

A large-scale analysis of tissue-specific pathology and gene expression of human disease genes and complexes

Affiliations

A large-scale analysis of tissue-specific pathology and gene expression of human disease genes and complexes

Kasper Lage et al. Proc Natl Acad Sci U S A. .

Abstract

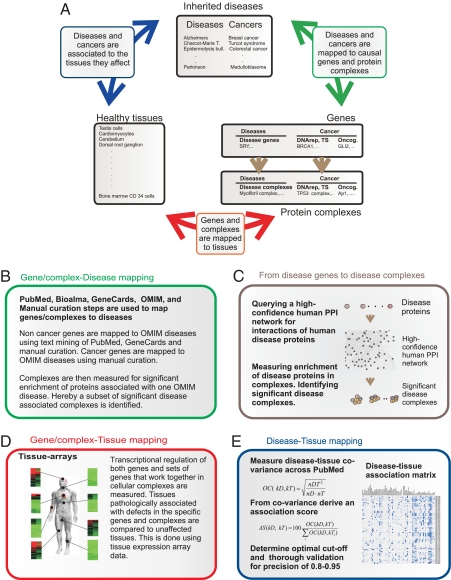
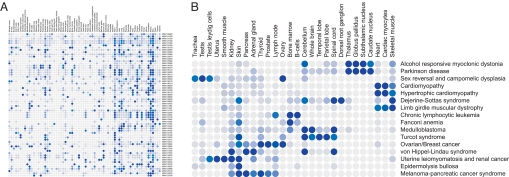
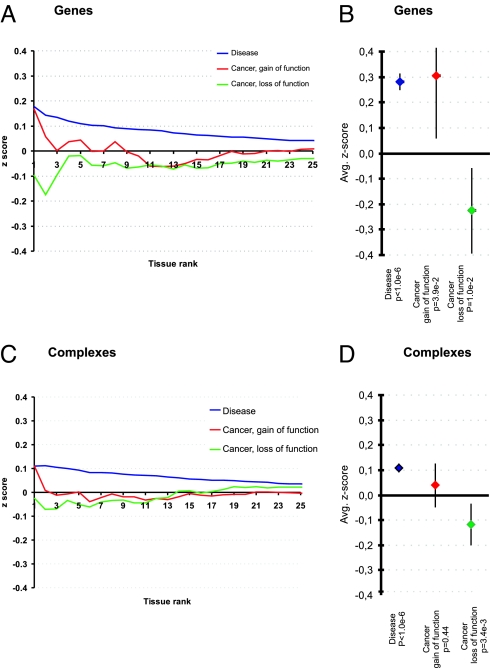
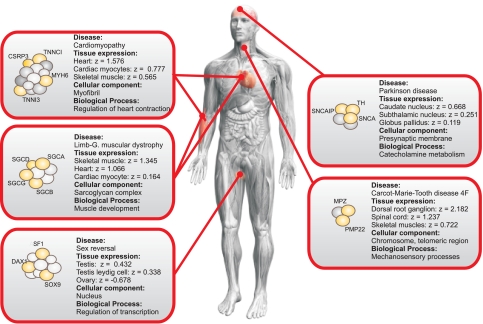
Heritable diseases are caused by germ-line mutations that, despite tissuewide presence, often lead to tissue-specific pathology. Here, we make a systematic analysis of the link between tissue-specific gene expression and pathological manifestations in many human diseases and cancers. Diseases were systematically mapped to tissues they affect from disease-relevant literature in PubMed to create a disease-tissue covariation matrix of high-confidence associations of >1,000 diseases to 73 tissues. By retrieving >2,000 known disease genes, and generating 1,500 disease-associated protein complexes, we analyzed the differential expression of a gene or complex involved in a particular disease in the tissues affected by the disease, compared with nonaffected tissues. When this analysis is scaled to all diseases in our dataset, there is a significant tendency for disease genes and complexes to be overexpressed in the normal tissues where defects cause pathology. In contrast, cancer genes and complexes were not overexpressed in the tissues from which the tumors emanate. We specifically identified a complex involved in XY sex reversal that is testis-specific and down-regulated in ovaries. We also identified complexes in Parkinson disease, cardiomyopathies, and muscular dystrophy syndromes that are similarly tissue specific. Our method represents a conceptual scaffold for organism-spanning analyses and reveals an extensive list of tissue-specific draft molecular pathways, both known and unexpected, that might be disrupted in disease.


Conflict of interest statement

The authors declare no conflict of interest.

Figures

Fig. 1.
Fig. 1.
Overview of the study. (A) The different analyses and how they relate to each other. (B) 59 inherited cancers and >1,000 other Mendelian disorders are mapped to 2,227 causative genes and 1,524 complexes by using a combination of automated parsing of OMIM and PubMed. Genes and complexes are stratified into 3 major categories, noncancer disease, cancer gain of function, and cancer loss of function. This stratification is done by a combination of manual curation and semiautomated steps. (C) A unique set of 1,524 protein complexes associated with disease are generated by querying the proteins of disease genes for direct interaction partners in a human protein interaction network followed by several quality control steps. (D) Transcriptional regulation of both genes and sets of genes that work together in cellular complexes are analyzed across tissues of the human organism. (E) Diseases are mapped to relevant tissues by using association degree of particular diseases and tissues across PubMed. Steps are taken to reduce errors in word recognition and handle synonyms accurately. These steps are followed by determination of an optimal cutoff and rigorous quality control. Hereby, we produced a matrix where diseases are mapped to tissues relevant to the pathology with a precision of >0.8. Cancers are mapped to tissues that are the primary origin of tumor formation with a precision >0.95.
Fig. 2.
Fig. 2.
Disease–tissue association matrix. The color range goes from light gray, which corresponds to no association of disease and tissue, to dark blue at 12% association. Only high confidence associations scoring above 8% (blue to dark blue) are used in the further analysis. The percent association is the proportion of a disease's association to a particular tissue in the Novartis Research Foundation Gene Expression Database (GNF) atlas, out of the cumulative association to all tissue in the atlas. (A) The first 100 diseases mapped to the 73 tissues in the GNF atlas. A more detailed view of the matrix can be seen by using the zoom tool. (B) A subset of the disease–tissue associations.
Fig. 3.
Fig. 3.
Expression levels of disease genes and complexes in pathologically associated tissues. (A) The expression level of genes associated with diseases and cancers in the tissues most associated with the particular disease caused by the genes. Tissues are ranked with the most associated tissue at the intersection with the y axis and in declining order from left to right. This plot shows the trend of overexpression for disease genes and gain-of-function cancer genes in tissues with the highest rank. Loss-of-function cancer genes are generally underexpressed in the tissues with the highest rank. (B) The average disease gene expression in associated tissues is shown. Disease genes are overexpressed with an average z score of 0.28 (P < 10E-6). The cancer-associated genes show 2 different trends: gain-of-function genes follow the trend of all disease genes, with an average z score of 0.30 (P = 3.9E-2), but loss-of-function genes have a tendency to be underexpressed in the tissues associated with tumor formation, with an average z score of −0.21 (P = 1.0e-2). (C and D) The same analysis is shown at the level of protein complexes, where the trend is conserved.
Fig. 4.
Fig. 4.
Representative examples of disease complexes are displayed. Diseases are associated with tissues by using our disease–tissue matrix, and expression data are from the GNF dataset. The expression levels of complexes are shown as z scores. If a disease is associated with more than 3 tissues, only the 3 most associated tissues are shown for clarity. In a given complex, proteins relevant to the disease in question are yellow. The figure shows the general tendency of overexpression of the complexes in the tissues in which they are involved in pathology compared with their expression level in other tissues. All members of the complexes can be seen in Fig. S5.

References

    1. Winter EE, Goodstadt L, Ponting CP. Elevated rates of protein secretion, evolution, and disease among tissue-specific genes. Genome Res. 2004;14:54–61. - PMC - PubMed
    1. Goh KI, et al. The human disease network. Proc Natl Acad Sci USA. 2007;104:8685–8690. - PMC - PubMed
    1. Chao EC, Lipkin SM. Molecular models for the tissue specificity of DNA mismatch repair-deficient carcinogenesis. Nucleic Acids Res. 2006;34:840–852. - PMC - PubMed
    1. Vogelstein B, Lane D, Levine AJ. Surfing the p53 network. Nature. 2000;408:307–310. - PubMed
    1. Beyer K, et al. Identification and characterization of a new alpha-synuclein isoform and its role in Lewy body diseases. Neurogenetics. 2008;9:5–23. - PubMed

Publication types

MeSH terms