. 2008 Dec 23;105(51):20083-8.
doi: 10.1073/pnas.0806009105. Epub 2008 Dec 22.

Dissecting early regulatory relationships in the lamprey neural crest gene network

Affiliations

Dissecting early regulatory relationships in the lamprey neural crest gene network

Natalya Nikitina et al. Proc Natl Acad Sci U S A. .

Abstract

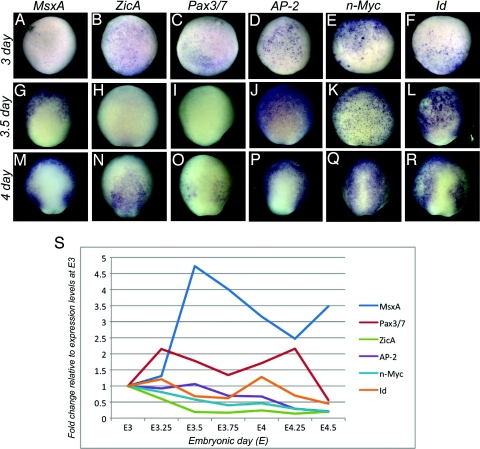
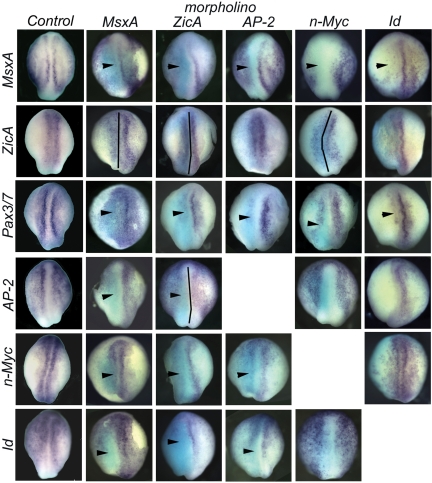
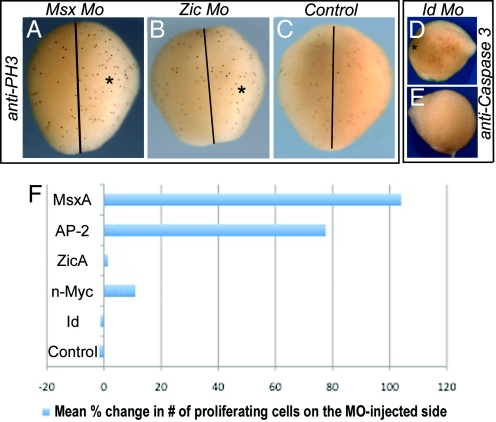
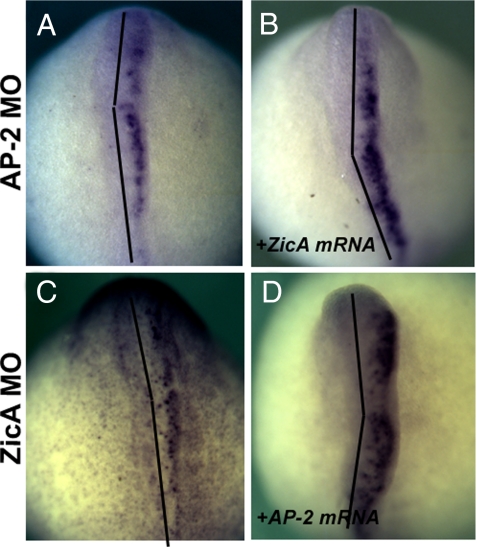
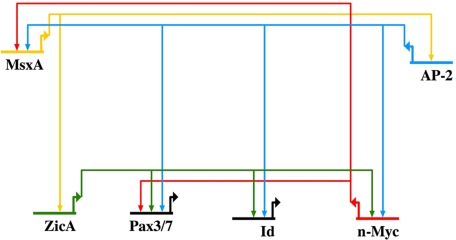
The neural crest, a multipotent embryonic cell type, originates at the border between neural and nonneural ectoderm. After neural tube closure, these cells undergo an epithelial-mesenchymal transition, migrate to precise, often distant locations, and differentiate into diverse derivatives. Analyses of expression and function of signaling and transcription factors in higher vertebrates has led to the proposal that a neural crest gene regulatory network (NC-GRN) orchestrates neural crest formation. Here, we interrogate the NC-GRN in the lamprey, taking advantage of its slow development and basal phylogenetic position to resolve early inductive events, 1 regulatory step at the time. To establish regulatory relationships at the neural plate border, we assess relative expression of 6 neural crest network genes and effects of individually perturbing each on the remaining 5. The results refine an upstream portion of the NC-GRN and reveal unexpected order and linkages therein; e.g., lamprey AP-2 appears to function early as a neural plate border rather than a neural crest specifier and in a pathway linked to MsxA but independent of ZicA. These findings provide an ancestral framework for performing comparative tests in higher vertebrates in which network linkages may be more difficult to resolve because of their rapid development.


Conflict of interest statement

The authors declare no conflict of interest.

Figures

Fig. 1.
Fig. 1.
Expression of neural crest network genes in the midgastrula to early neurula. (A–R) Dorsal view of in situ hybridization patterns showing expression of neural plate border (MsxA, Pax3/7, and ZicA) and early neural crest specifiers (AP-2, n-Myc, and Id) in lamprey at early gastrula (E3; A–F), midgastrula (E3.5; G–L), and early neurula stages (E4; M–R). Anterior is to the top. (A–F) All of the transcripts, except MsxA, are clearly present at the onset of gastrulation (E3). (G and J–L) At midgastrula, MsxA is expressed in the ventral ectoderm, but not in the prospective neural plate (G), whereas AP-2, n-Myc and Id are expressed ubiquitously throughout the ectoderm (J–L). (H and I) Expression of Pax3/7 and ZicA declines by E3.5. (N and O) At E4 ZicA is seen in the neural plate (N), whereas Pax3/7 is confined to the neural plate border (O). (M–R) By E4, MsxA, AP-2, and Id are expressed in the ectoderm and neural plate border, whereas n-Myc is present throughout the ectoderm including the neural plate. (S) Quantitative progression of border/early specifier expression between E3 and E4.5 by QPCR. The dynamic changes in transcription level of individual genes are depicted as fold-changes relative to their levels at E3. (Magnification: A–R, 20×.)
Fig. 2.
Fig. 2.
Effect of MO-mediated knockdown of 3 neural plate border specifiers and 3 neural crest specifiers on neural plate border formation and gene expression. Dorsal view of stage E4.5 lamprey neurula, anterior is to the top. MO-injected side, marked with the light blue stain after anti-FITC antibody staining, is to the left (MsxA, ZicA, Ap-2, and n-Myc columns). Id MO was coinjected with rhodamine-dextran as a tracer (Id column). MsxA MO injection caused loss of MsxA, Pax3/7, and AP-2 expression from the neural plate border, expansion of ZicA expression (caused by the expansion of the neural plate) and loss of Id and n-Myc expression from the posterior neural plate border (MsxA column). Injection of ZicA MO had a similar effect on MsxA, ZicA, and Pax3/7 expression, whereas AP-2 was lost from the neural plate border specifically, and n-Myc and Id were lost or decreased in the entire neural plate border (ZicA column). Phenotypes of AP-2 injected embryos were very similar to those seen in MsxA MO-injected embryos (compare AP-2 column to MsxA column). N-Myc MO resulted in the down-regulation of MsxA and Pax3/7, whereas AP-2 and Id expression appeared unaffected. Id MO caused loss of MsxA, Pax3/7, and AP-2 expression, without affecting ZicA or n-Myc. Black vertical lines indicate the midline. Arrowheads indicate loss of gene expression in the neural plate border. (Magnification: 18×.)
Fig. 3.
Fig. 3.
Loss of Msx protein significantly enhances cell proliferation, whereas loss of Id may induce cell death. (A–C) Dorsal view of embryos examined at E4.5 after introduction of indicated MO on the right (*). There is increased proliferation, as assayed by phosphohistone H3 expression (anti-PH3), after Msx MO treatment (A), but not in Zic MO-treated (B) or control embryos (C). Black line indicates the midline. (D and E) Side view of Id MO-treated embryos shows increased cell death on the injected (D) compared with control (E) side, as shown by anti-cleaved Caspase3 expression (anti-Caspase 3). (F) Mean percentage change in number of proliferating cells on the MO-injected versus control side. The MOs used are indicated on the left. (Magnification: A–C, 25×; D and E, 12×.)
Fig. 4.
Fig. 4.
ZicA and AP-2 act in parallel pathways to bring about the formation of the neural plate border. Embryos were injected with AP-2 (A) or ZicA (C) MO or a combination of ZicA MO and AP-2 mRNA (B) or AP-2 MO and ZicA mRNA (D). The effects on neural crest formation were assessed at E5.5 by staining for the neural crest marker FoxD-A. Both AP-2 and ZicA MO abolish the marker expression on the injected side (A and C), whereas coinjection with ZicA mRNA and AP-2 mRNA, respectively, does not rescue this phenotype (B and D). These experiments suggest that these 2 genes act in parallel pathways. Black lines indicate the midline. (Magnification: 40×.)
Fig. 5.
Fig. 5.
Current status of the NC-GRN in the lamprey.

References

    1. Hall BK, Hörstadius S. The Neural Crest. Oxford: Oxford Univ Press; 1988.
    1. Le Douarin NM, Kalcheim C. The Neural Crest. 2nd Ed. Cambridge, UK: Cambridge Univ Press; 1999.
    1. Monsoro-Burq AH, Wang E, Harland R. Msx1 and Pax3 cooperate to mediate FGF8 and WNT signals during Xenopus neural crest induction. Dev Cell. 2005;8:167–178. - PubMed
    1. Sato T, Sasai N, Sasai Y. Neural crest determination by coactivation of Pax3 and Zic1 genes in Xenopus ectoderm. Development. 2005;132:2355–2363. - PubMed
    1. Basch ML, Bronner-Fraser M, Garcia-Castro MI. Specification of the neural crest occurs during gastrulation and requires Pax7. Nature. 2006;441:218–222. - PubMed

Publication types

Substances