. 2009 Jan;119(1):182-92.
doi: 10.1172/JCI36470. Epub 2008 Dec 22.

Infiltration of CD4+ lymphocytes into the brain contributes to neurodegeneration in a mouse model of Parkinson disease

Affiliations

Infiltration of CD4+ lymphocytes into the brain contributes to neurodegeneration in a mouse model of Parkinson disease

Vanessa Brochard et al. J Clin Invest. 2009 Jan.

Abstract

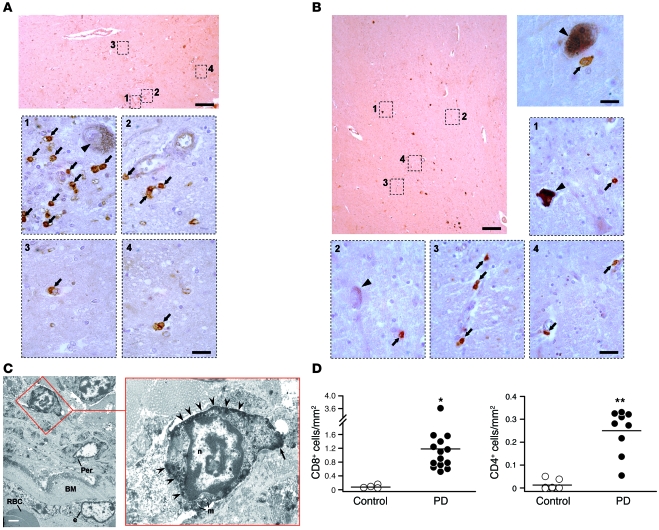
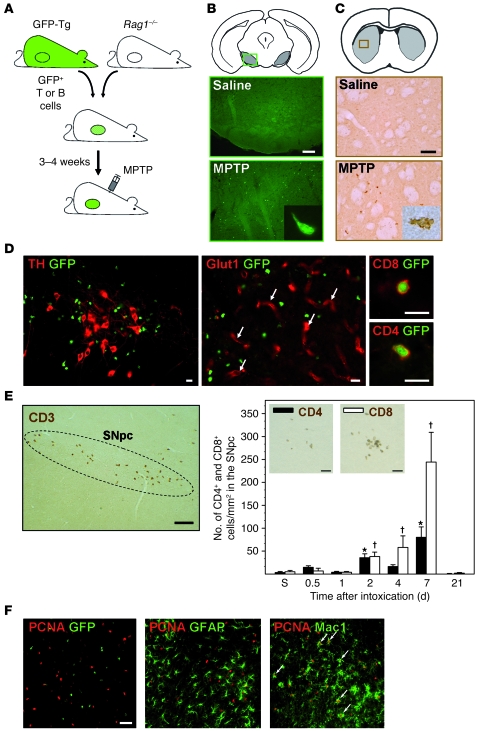
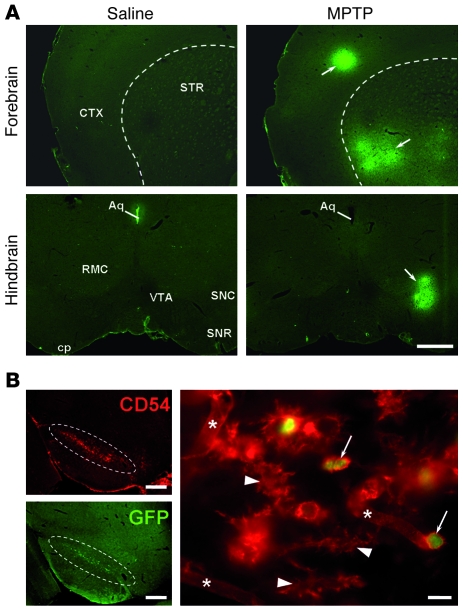
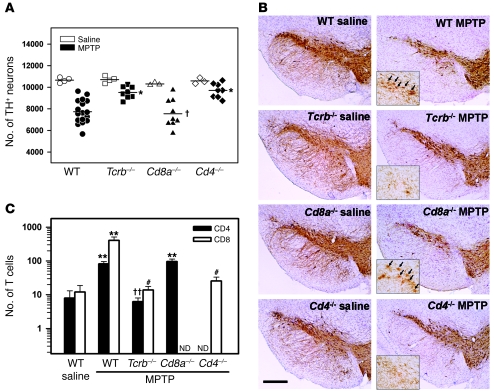
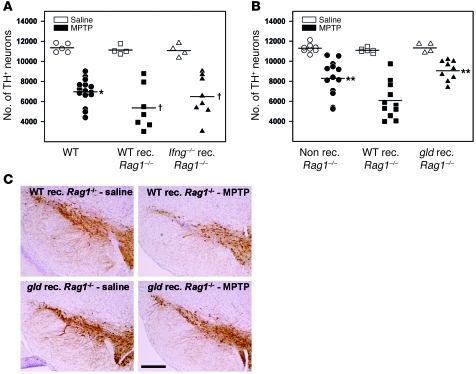
Parkinson disease (PD) is a neurodegenerative disorder characterized by a loss of dopamine-containing neurons. Mounting evidence suggests that dopaminergic cell death is influenced by the innate immune system. However, the pathogenic role of the adaptive immune system in PD remains enigmatic. Here we showed that CD8+ and CD4+ T cells but not B cells had invaded the brain in both postmortem human PD specimens and in the 1-methyl-4-phenyl-1,2,3,6-tetrahydropyridine (MPTP) mouse model of PD during the course of neuronal degeneration. We further demonstrated that MPTP-induced dopaminergic cell death was markedly attenuated in the absence of mature T lymphocytes in 2 different immunodeficient mouse strains (Rag1-/- and Tcrb-/- mice). Importantly, similar attenuation of MPTP-induced dopaminergic cell death was seen in mice lacking CD4 as well as in Rag1-/- mice reconstituted with FasL-deficient splenocytes. However, mice lacking CD8 and Rag1-/- mice reconstituted with IFN-gamma-deficient splenocytes were not protected. These data indicate that T cell-mediated dopaminergic toxicity is almost exclusively arbitrated by CD4+ T cells and requires the expression of FasL but not IFNgamma. Further, our data may provide a rationale for targeting the adaptive arm of the immune system as a therapeutic strategy in PD.


Figures

Figure 1
Figure 1. Lymphocyte infiltration in brains of patients of with PD.
(A) CD8 and (B) CD4 immunostaining with hematein counterstain on mesencephalic transverse sections from PD patients. CD8+ or CD4+ T cells (arrows) are found in close contact with blood vessels or have migrated deep into the brain parenchyma close to neuromelanin-containing DNs (arrowheads). Note that brain staining for CD79α and CD20 (B cells) and CD57 (NK cells) was not detected in either group of patients. All antibodies were previously tested on human tonsil tissue sections taken as a positive control, and all of them gave the expected cellular staining (Supplemental Figure 1). Scale bars: 250 μm (upper panel in A and upper-left panel in B); 30 μm (dashed boxes); 15 μm (upper-right panel in B). (C) Ultrastructural view of an infiltrated CD8+ T cell in the SNpc from a parkinsonian patient. Parenchymal CD8+ T cells display a small cytoplasmic volume, membrane-type CD8 staining (arrowheads), and a uropod-like cytoplasmic extension, usually involved in T cell motility (arrow). Per, pericyte; BM, basal membrane; e, endothelial cell; m, mitochondria; n, nucleus. Scale bar: 4 μm. (D) Density of infiltrated CD8+ (left panel) and CD4+ T cells (right panel) in the SNpc of parkinsonian patients (n = 14 and 9 for CD8 and CD4 staining, respectively) and age-matched control subjects (n = 4 and 7 for CD8 and CD4 staining, respectively). Bars represent the mean density. *P < 0.05, **P < 0.001 compared with controls (Student’s t test).
Figure 2
Figure 2. MPTP-induced nigrostriatal pathway injury stimulates T cell brain infiltration in mouse.
(A) Schematic representation of the experimental approach (see Methods). The green circle within reconstituted mice refers to the lymphoid compartments replenished with GFP+ cells. (B) GFP+ T cell infiltration in the SNpc and (C) striatum following MPTP intoxication. Numerous GFP+ T cells can be seen in the SNpc 2 days after MPTP but not saline exposure. GFP+ T cells are also found in the striatum from intoxicated mice, though there are far fewer than in the SNpc. Scale bars: 300 μm (B); 100 μm (C); 10 μm (insets). (D) Immunofluorescent staining for TH, Glut1, CD8, or CD4. Note that infiltrated GFP+ T cells are clustered within the SNpc in close proximity to TH+ DNs. Transmigrated GFP+ T cells are not found in the lumen of Glut1+ blood vessels (arrows) and consist of both CD8+ and CD4+ T cell subsets. Scale bars: 20 μm. (E) T cell brain infiltration in MPTP-treated C57BL/6 inbred mice. CD3 immunostaining showing numerous T lymphocytes within the SNpc (dashed line) from MPTP-treated mice (left panel). Scale bar: 100 μm. Kinetic of nigral CD4+ and CD8+ T cell (insets) density after MPTP exposure (right panel). S, saline. Data points represent the mean ± SEM. *P < 0.01 compared with saline- and MPTP-treated mice at day 4 after MPTP exposure; P < 0.01 compared with saline-treated controls (Tukey post-hoc analysis). Scale bars: 50 μm. (F) Double immunofluorescence staining for PCNA and GFP and GFAP or Mac1. Note that PCNA+ cells in the SNpc never colocalize with GFP+ or GFAP+ cells, whereas they superpose perfectly with Mac-1+ macrophages/microglial cells (arrows). Scale bar: 50 μm.
Figure 3
Figure 3. Mechanism of lymphocyte entry into the brain.
(A) Immunofluorescent staining for serum albumin on brain sections (forebrain and hindbrain levels are shown) from mice sacrificed 6 hours after the last MPTP or saline injection. Patches of staining (arrows) are detected in various brain areas at 6 hours following MPTP exposure but not after saline treatment. The dashed line indicates the boundary between the striatal and cortical areas. CTX, cortex; STR, striatum; RMC, magnocellular part of the red nucleus; VTA, ventral tegmental area; SNC, substantia nigra compacta; SNR, substantia nigra reticulata; Aq, aqueduct of Sylvius; cp, cerebral peduncle. Scale bar: 300 μm. (B) Immunostaining for CD54/ICAM-1 (red) on mesencephalic sections from MPTP-intoxicated GFP+ T cell–reconstituted Rag–/– mice. The expression pattern of CD54 overlaps with that of the GFP+ T cell infiltrate within the SNpc (dashed line) (left panel). At higher magnification (right panel), CD54 expression is visible on GFP+ T cells (arrows), blood vessels (asterisks), and branched glial cells (arrowheads). Scale bars: 300 μm (left panel); 10 μm (right panel).
Figure 4
Figure 4. Mice deficient in CD4+ T cells are more resistant to MPTP.
(A) Quantification of TH+ DNs in the SNpc at day 7 after MPTP (4 × 18 mg/kg) or saline treatment in WT, Tcrb–/–, Cd8a–/–, and Cd4–/– mice. Bars represent the mean number of total nigral TH+ DNs. Open symbols indicate saline-treated animals and filled symbols indicate MPTP-treated animals. Each symbol represents 1 individual animal. A significant protection against MPTP-induced DN cell loss is observed in Tcrb–/– and Cd4–/– mice but not in Cd8a–/– animals as compared with their WT littermates. *P < 0.05 compared with MPTP-treated WT and Cd8a–/– mice; P = 0.956 compared with MPTP-treated WT littermates (Tukey post-hoc analysis). Nissl+ cell counts confirmed that TH+ cell loss was not a consequence of downregulated expression of TH (data not shown). (B) Representative photomicrographs of mesencephalic sections immunostained for TH with Nissl counterstain from saline- or MPTP-treated WT and lymphocytic deficient mice. Insets show Mac-1+ microglial cells (arrows) in the SNpc from the same animals. Scale bar: 300 μm; 100 μm (insets). (C) Quantification of the total number of infiltrated CD4+ and CD8+ T cells in the SNpc from MPTP-treated WT and lymphocytic deficient mice. MPTP-treated Cd8a–/– mice display as many CD4+ T cells as MPTP-treated WT littermates. **P < 0.05 compared with saline-injected WT mice (Mann-Whitney U test). ††P < 0.001 compared with MPTP-treated WT and Cd8a–/– mice; #P < 0.001 compared with MPTP-treated WT mice (Dunn test). ND, not detected.
Figure 5
Figure 5. FasL, but not IFN-γ, is required for T cell–mediated DN toxicity in MPTP mouse.
(A) Quantification of TH+ DNs in the SNpc at day 7 after MPTP (4 × 18 mg/kg) or saline treatment in WT and Rag1–/– mice reconstituted with spleen cells from either C57BL/6 inbred or Ifng–/– donors. All groups of animals are equally sensitive to MPTP-induced DN injury. *P < 0.05 compared with their saline counterparts; P < 0.05 compared with their saline counterparts but not different from MPTP-treated WT mice (Tukey post-hoc analysis). (B) Quantification of TH+ DNs in the SNpc at day 7 after MPTP (4 × 18 mg/kg) or saline treatment in nonreconstituted Rag1–/– mice (non rec. Rag1–/–) and in Rag1–/– mice reconstituted with spleen cells from either C57BL/6 or gld donors (WT rec. Rag1–/– and gld rec. Rag1–/–, respectively). Nonreconstituted Rag1–/– mice and gld rec. Rag1–/– mice are partially protected against MPTP-induced DN loss as compared with WT rec. Rag1–/– animals. **P < 0.01 compared with MPTP-intoxicated WT rec. Rag1–/– mice (Tukey post-hoc analysis). (A and B) Open symbols indicate saline-treated animals and filled symbols indicate MPTP-treated animals. Each symbol represents 1 individual animal. Bars represent the mean number of total nigral TH+ DNs. (C) Representative photomicrographs of mesencephalic sections immunostained for TH with Nissl counterstain from saline- or MPTP-treated WT rec. Rag1–/– and gld rec. Rag1–/– mice. Scale bar: 300 μm.

Comment in

  • J Clin Invest. 119:13.

References

    1. Dauer W., Przedborski S. Parkinson’s disease: mechanisms and models. Neuron. 2003;39:889–909. doi: 10.1016/S0896-6273(03)00568-3. - DOI - PubMed
    1. Chen H., et al. Nonsteroidal antiinflammatory drug use and the risk for Parkinson’s disease. Ann. Neurol. 2005;58:963–967. doi: 10.1002/ana.20682. - DOI - PubMed
    1. Wahner A.D., Bronstein J.M., Bordelon Y.M., Ritz B. Nonsteroidal anti-inflammatory drugs may protect against Parkinson disease. Neurology. 2007;69:1836–1842. doi: 10.1212/01.wnl.0000279519.99344.ad. - DOI - PubMed
    1. Nagatsu T., Mogi M., Ichinose H., Togari A. Changes in cytokines and neurotrophins in Parkinson’s disease. J. Neural Transm. Suppl. 2000;60:277–290. - PubMed
    1. Czlonkowska A., Kurkowska-Jastrzebska I., Czlonkowski A., Peter D., Stefano G.B. Immune processes in the pathogenesis of Parkinson’s disease — a potential role for microglia and nitric oxide. Med. Sci. Monit. 2002;8:RA165–RA177. - PubMed

Publication types

MeSH terms