

Estimating the confidence level of white matter connections obtained with MRI tractography
- PMID: 19104666
- PMCID: PMC2603475
- DOI: 10.1371/journal.pone.0004006
Estimating the confidence level of white matter connections obtained with MRI tractography
Abstract
Background: Since the emergence of diffusion tensor imaging, a lot of work has been done to better understand the properties of diffusion MRI tractography. However, the validation of the reconstructed fiber connections remains problematic in many respects. For example, it is difficult to assess whether a connection is the result of the diffusion coherence contrast itself or the simple result of other uncontrolled parameters like for example: noise, brain geometry and algorithmic characteristics.
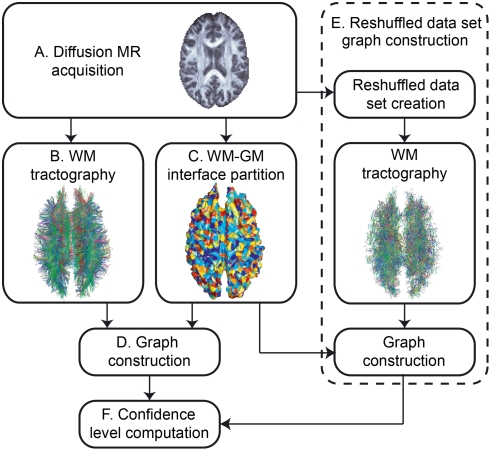
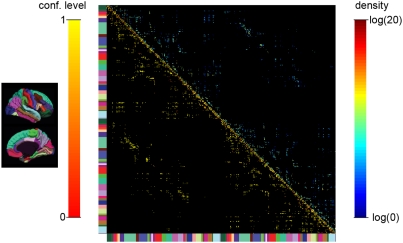
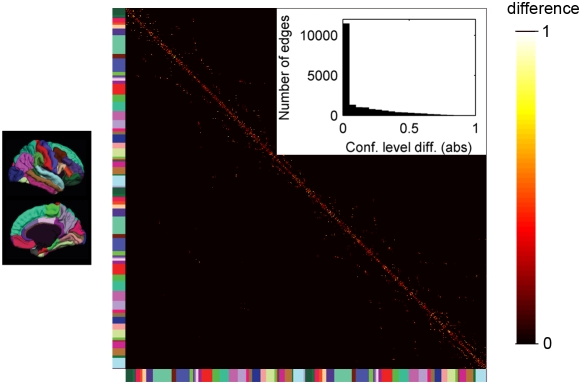
Methodology/principal findings: In this work, we propose a method to estimate the respective contributions of diffusion coherence versus other effects to a tractography result by comparing data sets with and without diffusion coherence contrast. We use this methodology to assign a confidence level to every gray matter to gray matter connection and add this new information directly in the connectivity matrix.
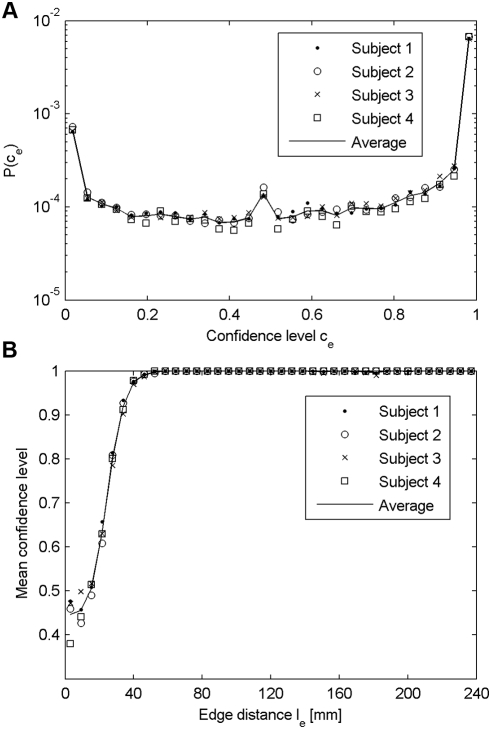
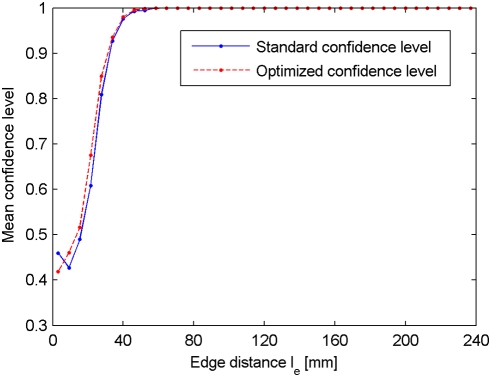
Conclusions/significance: Our results demonstrate that whereas we can have a strong confidence in mid- and long-range connections obtained by a tractography experiment, it is difficult to distinguish between short connections traced due to diffusion coherence contrast from those produced by chance due to the other uncontrolled factors of the tractography methodology.
Conflict of interest statement
Figures
References
-
- LeBihan D. Looking into the functional architecture of the brain with diffusion MRI. Nat Rev Neurosci. 2003;4:469–480. - PubMed
-
- Basser P, Mattiello J, LeBihan D. Estimation of the effective self-diffusion tensor from the NMR spin echo. J Magn Res B. 1994;103:247–254. - PubMed
-
- Wedeen VJ, Reese T, Tuch DS, Weigel M, Dou J-G, et al. Mapping fiber orientation spectra in cerebral white matter with fourier-transform diffusion MRI. Proc Intl Soc Mag Reson Med. 2000;8
-
- Wedeen VJ, Hagmann P, Tseng W-Y, Reese T, Weisskoff R. Mapping complex tissue architecture with diffusion spectrum magnetic resonance imaging. Magn Res Med. 2005;54:1377–1386. - PubMed
-
- Hagmann P, Jonasson L, Maeder P, Thiran J-P, Wedeen VJ, et al. Understanding Diffusion MR Imaging Techniques: From Scalar Diffusion-weighted Imaging to Diffusion Tensor Imaging and Beyond. Radiographics. 2006;26:205–223. - PubMed
Publication types
MeSH terms
LinkOut - more resources
Full Text Sources
Other Literature Sources
