. 2008;3(12):e4004.
doi: 10.1371/journal.pone.0004004. Epub 2008 Dec 23.

Genomic organization and expression demonstrate spatial and temporal Hox gene colinearity in the lophotrochozoan Capitella sp. I

Affiliations

Genomic organization and expression demonstrate spatial and temporal Hox gene colinearity in the lophotrochozoan Capitella sp. I

Andreas C Fröbius et al. PLoS One. 2008.

Abstract

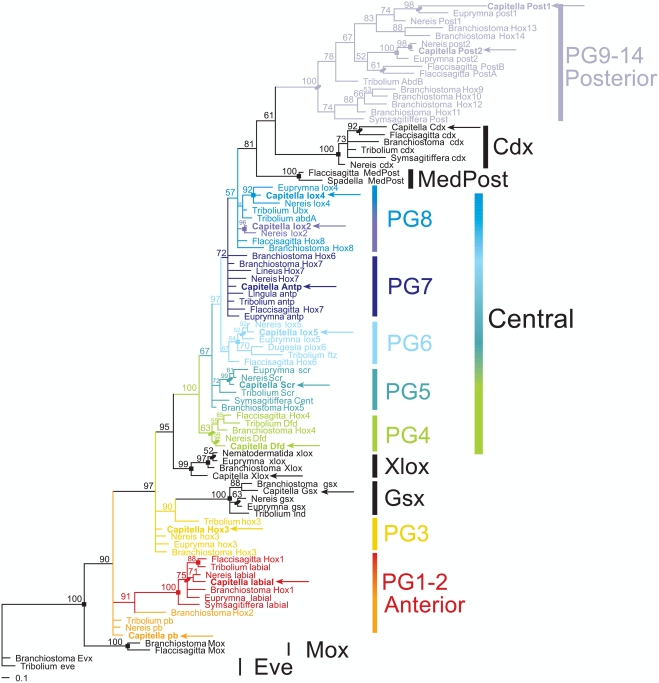
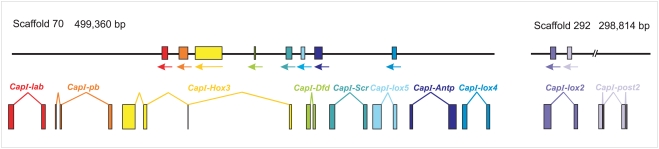
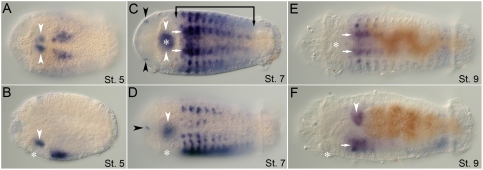
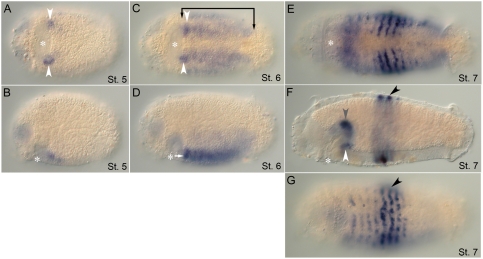
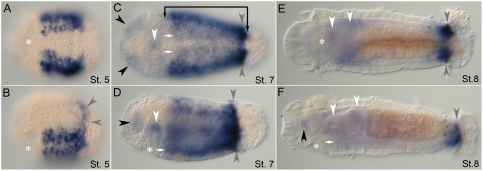
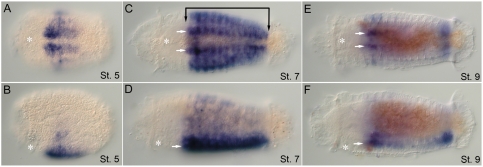
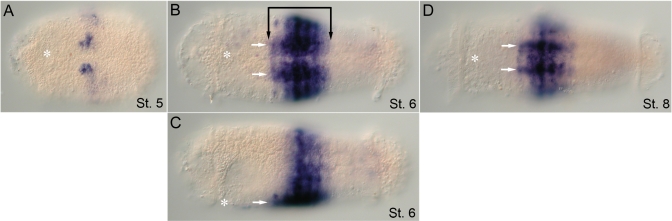
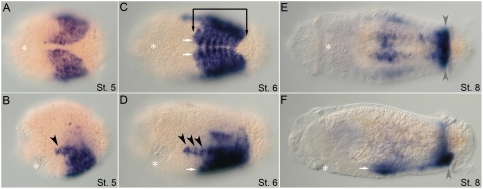
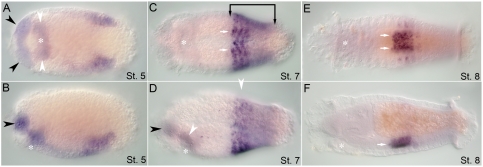
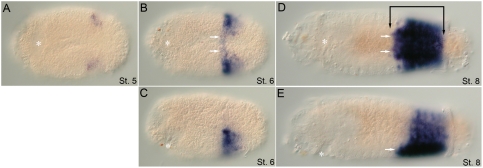
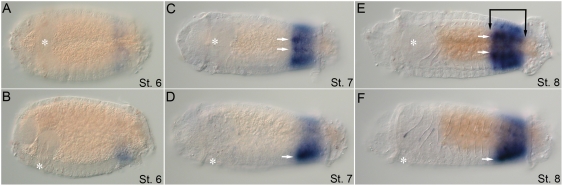
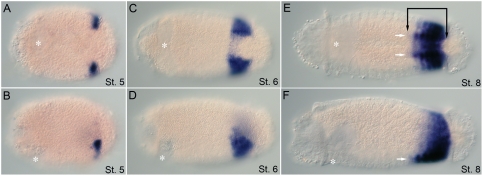
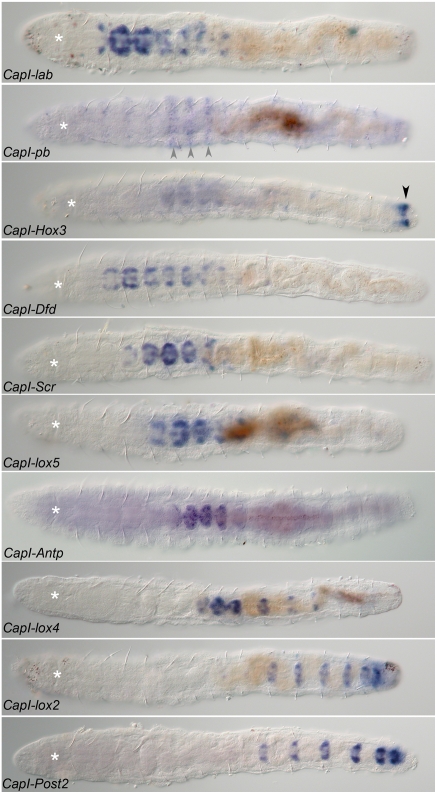
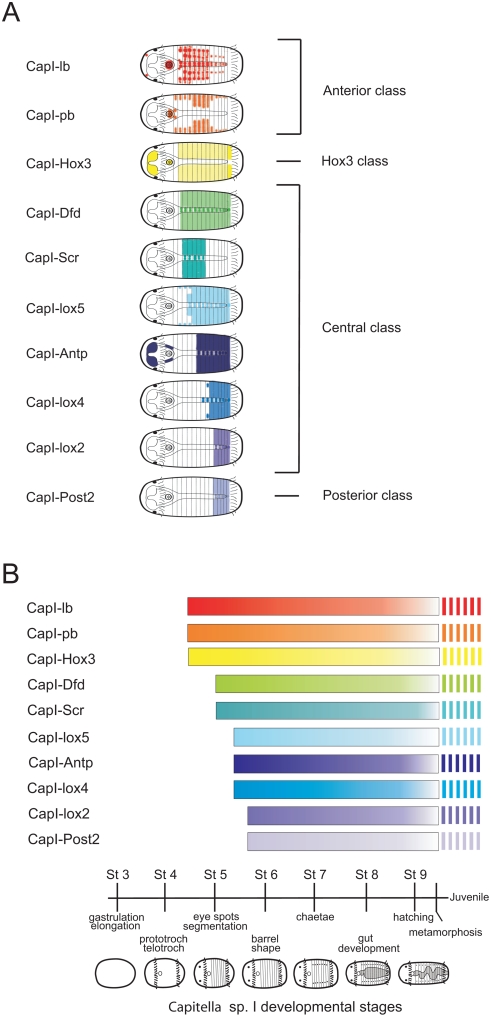
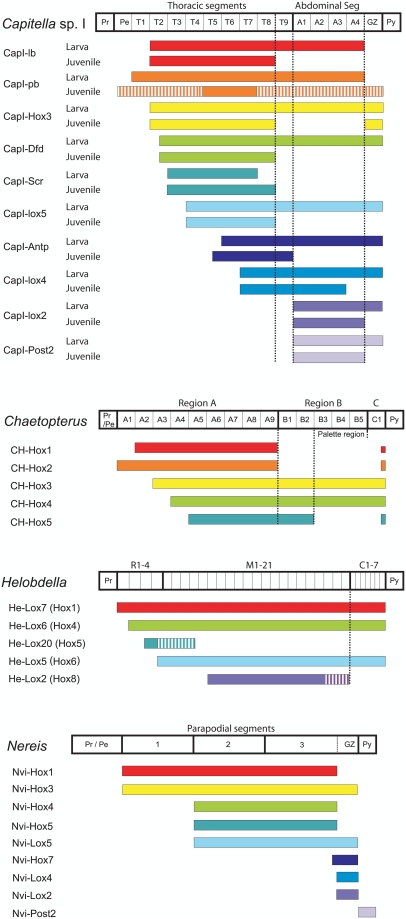
Hox genes define regional identities along the anterior-posterior axis in many animals. In a number of species, Hox genes are clustered in the genome, and the relative order of genes corresponds with position of expression in the body. Previous Hox gene studies in lophotrochozoans have reported expression for only a subset of the Hox gene complement and/or lack detailed genomic organization information, limiting interpretations of spatial and temporal colinearity in this diverse animal clade. We studied expression and genomic organization of the single Hox gene complement in the segmented polychaete annelid Capitella sp. I. Total genome searches identified 11 Hox genes in Capitella, representing 11 distinct paralog groups thought to represent the ancestral lophotrochozoan complement. At least 8 of the 11 Capitella Hox genes are genomically linked in a single cluster, have the same transcriptional orientation, and lack interspersed non-Hox genes. Studying their expression by situ hybridization, we find that the 11 Capitella Hox genes generally exhibit spatial and temporal colinearity. With the exception of CapI-Post1, Capitella Hox genes are all expressed in broad ectodermal domains during larval development, consistent with providing positional information along the anterior-posterior axis. The anterior genes CapI-lab, CapI-pb, and CapI-Hox3 initiate expression prior to the appearance of segments, while more posterior genes appear at or soon after segments appear. Many of the Capitella Hox genes have either an anterior or posterior expression boundary coinciding with the thoracic-abdomen transition, a major body tagma boundary. Following metamorphosis, several expression patterns change, including appearance of distinct posterior boundaries and restriction to the central nervous system. Capitella Hox genes have maintained a clustered organization, are expressed in the canonical anterior-posterior order found in other metazoans, and exhibit spatial and temporal colinearity, reflecting Hox gene characteristics that likely existed in the protostome-deuterostome ancestor.


Conflict of interest statement

Competing Interests: The authors have declared that no competing interests exist.

Figures

Figure 1
Figure 1. Orthology assignments for Capitella sp. I Hox genes.
Bayesian phylogenetic analysis was conducted using an alignment of the 60–amino acid homeodomain and the 12 amino acids immediately 3′ of the homeodomain for representative bilaterian Hox and Parahox genes. Capitella sp. I possesses orthologs for each Hox paralogy group (PG). Sequences from representative species include Tribolium castaneum (ecdysozoan); Nereis virens, Euprymna scolopes, and Capitella sp. I (lophotrochozoan); Flaccisagitta enflata and Spadella cephaloptera (chaetognath); Symsagitiffera roscoffensis and Nemertoderma westbladii (acoelomorphs); Branchiostoma floridae (deuterostome); and additional PG7 lophotrochozoan sequences (see Methods). Capitella sp. I sequences are delimited by arrows; Capitella sp. I Hox sequences are shown in bold. Numbers above branches indicate Bayesian posterior probabilities. Ovals delimit bootstrap support >50 at a node from either neighbor-joining (NJ) or maximum likelihood (ML) analyses, while squares show bootstrap support >50 from both NJ and ML analyses. Colors are unique to each Hox PG. Individual NJ and ML bootstrap consensus trees are shown in Figures S2 and S3, respectively.
Figure 2
Figure 2. Genomic organization of the Capitella sp. I Hox cluster.
A total of 11 Capitella sp. I Hox genes are distributed among three scaffolds. Black lines depict two scaffolds, which contain 10 of the Capitella sp. I Hox genes. The eleventh gene, CapI-Post1, is located on a separate scaffold surrounded by ORFs of non-Hox genes (unpublished data). No predicted ORFs were identified between adjacent linked Hox genes. Transcription units are shown as boxes denoting exons, connected by lines that denote introns. Transcription orientation is denoted by arrows beneath each box. Color coding is the same as that used in Figure 1 for each ortholog.
Figure 3
Figure 3. Expression of CapI-lab during larval development as analyzed by in situ hybridization.
Anterior is to the left for all panels. Stages are indicated at bottom right of each panel. (A), (C), and (E) show ventral views; (B), (D), and (F), lateral views. Asterisk marks position of the mouth. (A, B) At stage 5, CapI-lab is expressed in the dorsal wall of the stomodeum (white arrowheads) and in bilateral patches of anterior ectoderm. (C, D) CapI-lab expression at mid-stage 7 includes two clusters of 2 to 3 cells in head ectoderm (black arrowheads), dorsolateral and ventrolateral ectodermal domains and foregut tissue (white arrowheads). Bracket denotes anterior and posterior borders of CapI-lab expression in the mid-body. White arrows mark staining in the VNC. (E, F) Expression in the VNC (white arrows) and the posterior of the esophagus (white arrowhead) persists to the end of larval development (stage 9).
Figure 4
Figure 4. Expression patterns of CapI-pb during larval stages.
Anterior is to the left for all panels. Stages are indicated at the bottom right of each panel. (A), (C), and (E) show ventral views; (B), (D), (F), and (G), lateral views with ventral down. Asterisk marks the position of the mouth. (A, B) CapI-pb expression in two ectodermal clusters, lateral and slightly posterior to the mouth at stage 5 (white arrowheads). (C, D) At the transition from stage 6 to stage 7, CapI-pb is expressed in the VNC (white arrow), including prominent expression in the subesophageal ganglion (white arrowheads), and ventro-lateral epidermis of all segments (bracket). (E, F) By late stage 7/early stage 8, the trunk has a segmentally iterated ectodermal stripe pattern (black arrowhead). Additional CapI-pb expression appears in the foregut (gray arrowhead), Expression persists in the subesophageal ganglion (white arrowhead). (G) Surface view showing segmentally iterated ectodermal stripes of expression, which is most prominent in T5 to T7 (black arrowhead).
Figure 5
Figure 5. Larval expression of CapI-Hox3.
Anterior is to the left for all panels. Stages indicated at bottom right of each panel. (A), (C), and (E) show ventral views; (B), (D), and (F), lateral views with ventral down. Position of the mouth is marked by an asterisk. (A, B) CapI-Hox3 is expressed in the ventrolateral ectoderm of all segments and in the growth zone (stage 5) (gray arrowheads). (C, D) Expression in the lateral epidermis (bracket) and VNC (VNC, white arrows) of all segments, and in the posterior growth zone (gray arrowheads) at stage 7. Black arrowhead marks brain expression. White arrowhead marks expression in the dorsal wall of the stomodeum. (E, F) At late stage 8/early stage 9, expression is prominent in the posterior segments and growth zone (gray arrowheads), and weak in the VNC (white arrow), esophagus and pharynx (white arrowheads), and brain (black arrowhead).
Figure 6
Figure 6. CapI-Dfd larval expression patterns.
Anterior is to the left for all panels. Stages are written at the bottom right of each panel. (A), (C), and (E) show ventral views; (B), (D), and (F), lateral views. Asterisk marks position of the mouth. (A, B) At late stage 4, there is ventral ectodermal expression along the medial border of the belly plates. (C, D) At stage 7, expression includes the VNC (white arrows) and lateral ectoderm from T2 to the telotroch. (E, F) Expression is most prominent in the VNC of T2 (white arrows) and in the posterior-most segments and growth zone. Low levels of body epidermis expression persist.
Figure 7
Figure 7. Expression patterns of CapI-Scr during larval stages.
Anterior is to the left for all panels. Stages are indicated at bottom right of each panel. (A), (B), and (D) show ventral views; (C), lateral view. Asterisk marks position of the mouth. (A) Initiation of CapI-Scr expression at late stage 4 straddling the midline in T3 and T4 with weaker ventro-lateral expression in these segments. (B, C) Expression is in the VNC (white arrows) and lateral ectoderm in segments T3 to T7 (bracket). (D) Expression at stage 8 is very similar to the pattern at stage 6 (compare with [B]).
Figure 8
Figure 8. Larval expression of CapI-lox5.
Anterior is to the left for all panels. Stages are indicated at bottom right of each panel. (A), (C), and (E) show ventral views; (B), (D), and (F), lateral views with ventral down. Mouth is marked by an asterisk. (A, B) Expression in the ventrolateral ectoderm extends from T4 to the posterior border of the belly plates at early stage 5. Lateral bands extend rostrally from the broad expression domain (black arrowhead). (C, D) Expression is in the VNC (white arrows), ventrolateral ectoderm, and in segmentally iterated lateral patches (black arrowheads). (E, F) At stage 8, CapI-lox5 expression becomes most prominent in the VNC (white arrows) and posterior growth zone (gray arrowheads).
Figure 9
Figure 9. CapI-Antp expression during larval development.
Anterior is to the left for all panels. Stages are at the bottom right of each panel. (A), (C), and (E) show ventral views; (B), (D), and (F), lateral views with ventral down. Asterisk marks the position of the mouth. (A, B) CapI-Antp is expressed in the posterior half of the mid-body in the ventrolateral ectoderm, the brain (black arrowhead), and the presumptive foregut (white arrowheads). (C, D) Expression in the VNC (white arrows) and lateral ectoderm spans segments T6 to the telotroch (bracket). Expression is consistently strongest in T6 to T8. Weak expression in brain (black arrowhead) and foregut (white arrowhead) is still detectable. (E, F) Expression is largely restricted to the VNC of thoracic segments T5 to T9 by stage 8 (white arrows).
Figure 10
Figure 10. Larval expression of CapI-lox4.
Anterior is to the left for all panels. Stages indicated at bottom right of each panel. (A), (B), and (D) show ventral views; (C) and (E), lateral views with ventral down. Asterisk marks position of the mouth. (A, B) Onset of CapI-lox4 expression at early stage 5 in a ventro-lateral ectodermal domain in the posterior mid-body. (C, D) By stage 6, expression crosses the midline in T7 and connects the two ventro-lateral domains. (E, F) CapI-lox4 expression is most prominent at stage 8 and includes T7 to T9, all of the abdominal segments, and the growth zone (black bracket). White arrows point to VNC expression (white arrows).
Figure 11
Figure 11. Larval expression of CapI-lox2.
Anterior is to the left for all panels. Stages are written at the bottom right of each panel. (A), (C), and (E) show ventral views; (B), (D), and (F), lateral views with ventral down. The position of the mouth is marked by an asterisk. (A, B) CapI-lox2 expression is in the ventral and ventrolateral part of the ectoderm of the abdominal segments during stage 6. (C, D) By stage 7, expression in the VNC (white arrows) and ventral and lateral epidermis extends from A1 to the growth zone. (E, F) CapI-lox2 expression at stage 8 includes ectodermal expression in A1 to A4 and the growth zone (black bracket).
Figure 12
Figure 12. CapI-Post2 expression in larval stages.
Anterior is to the left for all panels. Stages are marked at the bottom right of each panel. (A), (C), and (E) show ventral views; (B), (D), and (F), lateral views with ventral down. The mouth is marked by an asterisk. (A, B) Initial expression is in ventrolateral ectodermal bands that span segments A1 and A2 during stage 5. Note absence of expression across the ventral midline. (C, D) By stage 6, additional abdominal segments have formed, and these segments also express CapI-Post2. Expression across the ventral midline appears, although it is weaker than the lateral expression domains. (E, F) At stage 8, expression is apparent in the VNC (white arrows) and in the ventral and lateral epidermis of all abdominal segments (black bracket).
Figure 13
Figure 13. Hox gene expression in juveniles.
All panels are ventral views with anterior to the left. Asterisk marks the position of the mouth. Gene names are in the lower left corner of each panel. Age of animals shown is 3 d after metamorphosis. Capitella Hox gene expressions are largely limited to a subset of VNC ganglia in juveniles. Exceptions include CapI-Hox3, which is expressed in the prepygidial growth zone (black arrowhead), and CapI-pb, which shows weak epidermal stripes (gray arrowheads).
Figure 14
Figure 14. Summary of Capitella sp. I spatial and temporal Hox gene expression in larvae.
(A) Schematic of larval expression patterns of 10 Hox genes. Patterns illustrated are for a mid-larval stage. Larvae have 13 segments at stage shown. (B) Diagram displaying the temporal onset of expression for the genes displayed in (A). Vertical stripes indicate persistence of expression into juvenile stages. Schematic of Capitella sp. I ontogenesis following gastrulation is shown at bottom of figure.
Figure 15
Figure 15. Comparison of Hox gene expression patterns across annelids.
Generalized diagram comparing boundaries of Hox gene expression along the main body axis of Capitella sp. I with expression boundaries in Helobdella, Chaetopterus, and Nereis. Body axis schematics are shown as boxed diagrams next to species names and include segments and tagmata for each species. Solid bars indicate strong expression and striped bars indicate weaker expression. For Nereis, the anterior border shown is the anterior Hox gene boundary at the earliest stage expressed. Pr indicates prostomium; Pe, peristome; and GZ, growth zone. Taxon-specific abbreviations: Capitella: T, thoracic segments; A, abdominal segments; and seg, segments. Chaetopterus: A, B, C, segments of body region A, B, and C, respectively. Helobdella: R, rostral segments; M, medial segments; and C, caudal segments.

Similar articles

Cited by

References

    1. Carroll SB. Homeotic genes and the evolution of arthropods and chordates. Nature. 1995;376:479–485. - PubMed
    1. Hughes CL, Kaufman TC. Hox genes and the evolution of the arthropod body plan. Evol Dev. 2002;4:459–499. - PubMed
    1. Duboule D. The rise and fall of Hox gene clusters. Development. 2007;134:2549–2560. - PubMed
    1. Krumlauf R. Hox genes in vertebrate development. Cell. 1994;78:191–201. - PubMed
    1. Ferrier DE, Holland PW. Ancient origin of the Hox gene cluster. Nat Rev Genet. 2001;2:33–38. - PubMed

Publication types

Substances