. 2008 Nov 24:2:3.
doi: 10.3389/neuro.04.003.2008. eCollection 2008.

A recurrent network in the lateral amygdala: a mechanism for coincidence detection

Affiliations

A recurrent network in the lateral amygdala: a mechanism for coincidence detection

Luke R Johnson et al. Front Neural Circuits. .

Abstract

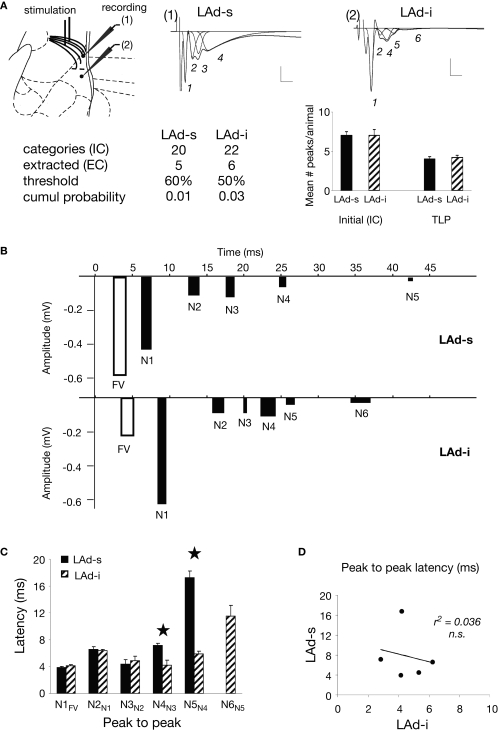
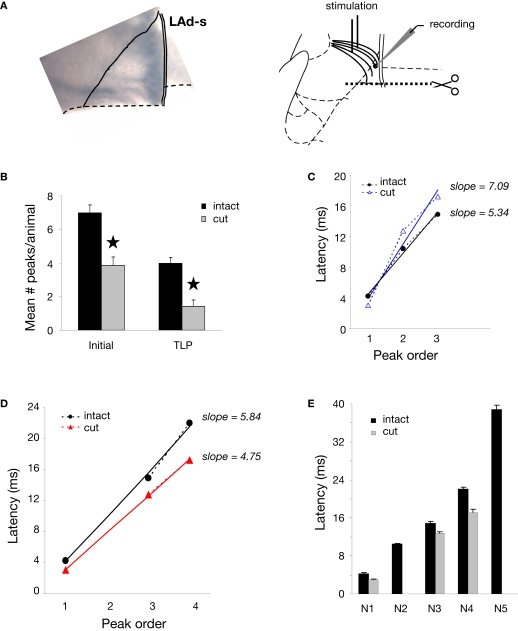
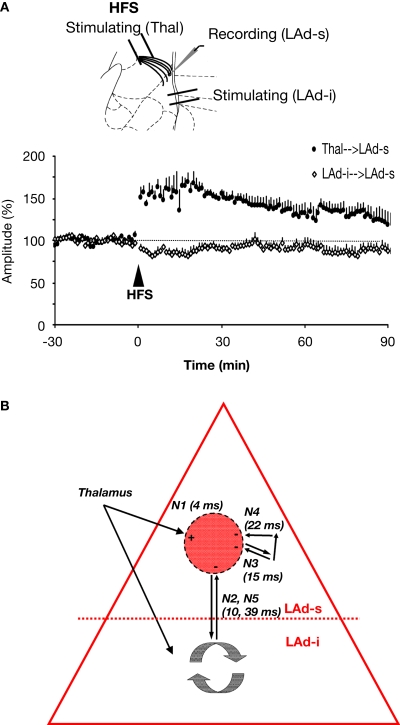
Synaptic changes at sensory inputs to the dorsal nucleus of the lateral amygdala (LAd) play a key role in the acquisition and storage of associative fear memory. However, neither the temporal nor spatial architecture of the LAd network response to sensory signals is understood. We developed a method for the elucidation of network behavior. Using this approach, temporally patterned polysynaptic recurrent network responses were found in LAd (intra-LA), both in vitro and in vivo, in response to activation of thalamic sensory afferents. Potentiation of thalamic afferents resulted in a depression of intra-LA synaptic activity, indicating a homeostatic response to changes in synaptic strength within the LAd network. Additionally, the latencies of thalamic afferent triggered recurrent network activity within the LAd overlap with known later occurring cortical afferent latencies. Thus, this recurrent network may facilitate temporal coincidence of sensory afferents within LAd during associative learning.

Keywords: Hopfield; LTD; autoassociative; feedback; polysynaptic; reverberation.


Figures

Figure 1
Figure 1
Polysynaptic activity in the superior lateral amygdala dorsal subnucleus (LAd-s) evoked by thalamic afferent stimulation is revealed by blockade of GABAergic inhibition and is eliminated by glutamatergic antagonism. (A) Example of FP traces from the LAd-s showing effect of PTX (75 μM). (B) Example of FP traces in LAd-s depicting effect of glutamatergic antagonism (10 μM CNQX + 100 μM APV). Only the presynaptic fiber volley (FV, *) remains. Scale = 0.1 mV, 10 ms.
Figure 2
Figure 2
Spatial properties of the FP in LAd-s and adjacent sites after stimulation of thalamic afferents. In order to ascertain the degree of temporal overlap of evoked potentials occurring in sites adjacent to the LAd-s, paired recordings of FP were made with a fixed recording electrode in the LAd-s (red dot) and another recording electrode that was moved to eight adjacent sites (A–H). Recording sites adjacent to the LAd-s in sequential order: (A) inferior lateral amygdala dorsal subnucleus (LAd-i); (B) lateral amygdala ventral lateral subnucleus (LAvl); (C) basal amygdala nucleus (BLA), (D) capsular division of the central amygdala nucleus (CeC), (E) amygdala striatal area (AStr), (F) ectorhinal cortex (Ect), (G) perirhinal cortex (PRh), (H) dorsal endopiriform nucleus (Den). FP recorded simultaneously from LAd-s (red traces) and from the numbered site of recording (black traces) are superimposed. Note the delayed latency of thalamic evoked synaptic activity in cortical structures (G,H). For more ventral amygdala locations and medial structures, thalamic evoked polysynaptic activity was observed (A–C,E). No peaks or counter peaks were observed that directly corresponded to those in the LAd-s. Qualitatively, the LAd-i FP was most similar to that observed in the LAd-s. Scale = 0.2 mV, 10 ms.
Figure 3
Figure 3
Schematic of the method used for the extraction of time-locked peaks (TLPs). The detailed methodology is described in the Materials and Methods section of the manuscript. (A) Example of an averaged FP recorded in vitro, and seven peaks fitted using PeakFit software, when excluding the stimulus artifact (black triangle) and fiber volley (*). For this particular case, following the procedure depicted in (B), five peaks were found to be reliable for this condition (in grey), while two peaks were not (in white). (B) Procedure for the extraction of TLPs. For clarity, the examples here depict hypothetical cases for which peak latencies are very well clustered among animals. For each animal and each peak latency (black dot), as fitted in (A), a “zone of variability” (box) was calculated around the peak latency. Then, the peaks across all animals in the same condition (e.g., in vitro LAd-s) were identified, and using their zones of variability, unique initial categories (IC, vertical lines) were defined. For example, in the case of in vitro LAd-s, 20 initial categories were formed. Of these, five were identified as reliably present across all animals and labelled “extracted categories” (EC, numbered in an ascending manner N1 to N5, corresponding to the centers of the gray boxes). For each animal, the peaks that coincided with the ECs are referred to as its time-locked peaks (TLPs). For instance, Rat 1 has only four TLPs, whereas Rat 4 has five [like in the example shown in (A)].
Figure 4
Figure 4
Temporal organization of TLPs in the dorsal lateral amygdala. (A) Atlas image depicts the location of stimulating electrode in extra-LA thalamic afferents fibers and two recording electrodes in the LAd-s and LAd-i. Example of FP traces from LAd-s (1, scale = 0.1 mV, 10 ms) and LAd-i (2, scale = 0.2 mV, 10 ms) depicting non-linear peak fitting and TLPs determined probabilistically (see Materials and Methods). From the initial number of categories found (IC), probabilistic analysis (threshold defining the minimum number of occurrence across animals resulting in a cumulative probability <0.05) extracted only few categories as reliably occurring between animals (EC). Averaged number of peaks per animal was reduced by approximately 50%, indicating that approximately 50% of all peaks detected using the non-linear curve fitting method are temporally reliable across animals (TLP). LAd-s example has TLPs N1–N4, LAd-i example has N1–N6, but misses N3. (B) Latency ranges (widths of bars) of TLPs in LAd-s and LAd-i shown in “real time” from stimulation artifact. Latency to the FV tended to be increased in the LAd-i consistent with a bigger distance between stimulating and recording electrodes. Analysis of variance indicated that these peaks were not occurring at the same time as there was a significant interaction between the two data sets F(5,54) = 80.18, p < 0.0001. Bonferroni post-hoc t-tests reveal N2 and N5 are significantly different at p < 0.01. (C) Comparison of peak to peak latencies [e.g. N1FV means (N1 latency–FV latency)] between TLPs of LAd-s and LAd-i. The first three TLPs arrive at similar latencies after their preceding ones at both recording sites. In comparison N4 and N5 occur later in the LAd-s compared to the LAd-i. *p < 0.05. (D) There was no correlation between peak to peak latencies in LAd-s and LAd-i, showing different rhythmic pattern in these two sub-areas of LAd.
Figure 5
Figure 5
Effect of NMDA antagonist APV (100 μM) on polysynaptic activity in LAd-s. (A) Example traces, control (blue) and after added APV (red). The difference in area under the trace of polysynaptic activity is also shown. (B) Mean peak amplitude was decreased [for N1–N5 peaks F(1,40) = 11.99, p < 0.002; post-hoc t-tests, N1 = ns; N2–N5 p < 0.05]. (C) All individual TLPs (N2–N5) were reduced (light line = no change) (D) Ratio of change in TLPs (N2–N5) indicating the change is non-uniform across TLPs [F(3,16) = 4.7, p < 0.02].
Figure 6
Figure 6
Ventral origin of recurrent activity in LAd network. (A) Example of an amygdala slice cut as schematically shown, with a removal of LAd-i, ventral amygdala nuclei and overlying cortex. Recordings were made in LAd-s network with stimulation of thalamic afferents. (B) Recordings from isolated LAd-s show a significant reduction in the number of polysynaptic peaks. Both the total number of peaks identified (initial) with non-linear curve fitting and the number of reliable peaks identified probabilistically (TLP) were reduced (p < 0.05) in the isolated LAd-s. (C) Extracted peak latency versus peak number shows linear relations when peaks were arranged sequentially with a difference in slope of 1.75 between intact and cut preparations. (D) When extracted peaks were arranged non-sequentially, based on closest matching latency, the correlation lines showed a difference in slope of 1.09. (E) Closest latencies and linear slopes reveal that isolation of LAd-s reduced the polysynaptic network to N1, N3, and N4. Therefore, sources of TLPs N2 and N5 are located ventrally.
Figure 7
Figure 7
Direct evidence for a functional ventral to dorsal LAd network. (A) Spatial organization of axon collaterals arborizing from two example neurons located in LAd-s and LAd-i. Dendrites are depicted in black and axons in grey (LAd-s) and orange (LAd-i). Note the axon collaterals from the LAd-s reach the vicinity of dendrites from the LAd-i neuron, and axon collaterals from the LAd-i reach the vicinity of dendrites from LAd-s neuron. Scale (mm) and outline from Paxinos and Watson 4th Ed. (B) Bipolar stimulating electrodes were placed in the LAd-i, and recordings were made from LAd-s. Stimulation of LAd-i evoked monosynaptic FP in the LAd-s. In the presence of PTX (75 μM) the monosynaptic potential increased in amplitude and polysynaptic activity is observable. The FP is eliminated by glutamatergic antagonism (10 μM CNQX + 100 μM APV).
Figure 8
Figure 8
Effect of thalamo-amygdala LTP on polysynaptic activity in the LAd-s, as compared to an increase in stimulation intensity. (A) Mean change (+SEM) in N1 amplitude in the LTP experiment (50-min post-tetanus vs. baseline) and in the control experiment (minimum vs. middle intensities). Current intensity was delivered at ≈33% (minimum, min) and ≈66% (middle, mid) of current needed for maximal N1 amplitude. Both LTP and control show a significant increase in N1 amplitude. (B) Example traces of baseline (blue) and after LTP (red). Inset, difference in area under trace of polysynaptic activity (N2–N5) shows a decrease in polysynaptic activity. (C) Example traces of control experiment, min (blue) and mid (red) intensities. Inset, difference in area under trace of polysynaptic activity (N2–N5) shows an increase in polysynaptic activity. (D) Change in peak amplitude for all TLPs (N2–N5) in LTP group. Most peaks were decreased after LTP (line = no change, baseline vs. LTP). (E) Change in peak amplitude for all TLPs (N2–N5) in control experiment. Most peaks were increased with intensity (line = no change, min vs. mid). (F) The number of TLPs (N2–N5) that were increased, decreased or not changed was significantly different between the LTP and control experiments. (G) In the depressed cases from LTP experiment, the decrease in peak amplitude was linearly correlated to its initial baseline value. (H) Mean ratio of change in peak amplitude after LTP shows the constant suppression ratio for all TLPs (N2–N5).
Figure 9
Figure 9
Polysynaptic activity in LAd-s originates from recurrent activity and is plastic. (A) Induction of thalamo-amygdala LTP induced LTD at intra-network LAd-i to LAd-s afferents. Both LTP and LTD lasted for at least 90 min. (B) Schematic model of the temporally structured and plastic recurrent network in LAd. The model describes the temporal sequence of polysynaptic excitatory activity mapped in the LAd-s in vitro, evoked by activation of the thalamic-amygdala path. The excitatory model is described in the absence of the GABA network of Samson and colleagues (2003). The activity of the model is described in “Network time”, as measured relative to the presynaptic conductivity prior to N1 activation (i.e. fiber volley, FV). Stimulation of thalamic fibers activates a monosynaptic connection in the LAd, which synchronizes polysynaptic activities (TLPs). Next, polysynaptic activation occurs via a network of LAd axon collaterals which provide an opportunity for network activity to influence proceeding amygdala afferent input. The first polysynaptic activity to occur (N2, 10 ms after FV in vitro) is direct ventro-dorsal and dorso-ventral connectivity (di-synaptic). This connectivity is an excitatory recurrent feedback connection to LAd-s. Further polysynaptic activity occurs via multisynaptic connectivity within the LAd-s (N3, N4). Our slice reduction data showed a further ventro-dorsal recurrent feedback from LAd-i to LAd-s (N5, 39 ms), which may well be resulting from N6 in the LAd-i. The model also incorporates functional aspects of the network. Monosynaptic LTP at thalamo-amygdala synapses (+) results in suppression of polysynaptic feedback synapses (−) on the same population of cells [see (A)].
Figure 10
Figure 10
Comparison with temporally organized polysynaptic LAd network in vivo. (A) Thalamic stimulation in the awake animal evoked in LAd-s a monosynaptic negative potential followed by multiple polysynaptic peaks (voltage trace). Scale = 0.1 mV, 10 ms. Text and histogram show extraction of TLPs detected with non-linear curve fitting and probabilistic logic (see Materials and Methods). Mean number of peaks per animal is reduced by approximately 50%, indicating that approximately 50% of all peaks detected using the non-linear curve fitting method are temporally reliable across animals (TLP). Atlas shows the recording electrode placements in the LAd-s. Electrodes are in same anterior–posterior location shown (black) or adjacent anterior–posterior positions (white). (B) Example trace with individual peaks fitted using non-linear peak fitting and identified as TLPs. Trace is partially shown to allow clearer observation of artifact (arrowhead), presynaptic FV (*) and TLPs N1 to N3 in (1) and N4 to N8 in (2). (C) Comparison of in vivo (N1 to N9) and in vitro (N1 to N5) peak amplitudes. (D) Comparison of in vivo and in vitro peak to peak latencies. (E) Linear relationship between in vitro and in vivo peak to peak latencies.
Figure 11
Figure 11
Model of temporal convergence between cortically processed sensory inputs and reverberating LAd structured network activity. When a stimulus like a tone is presented, it evokes rapid responses in the auditory thalamus that are transmitted to the LA both directly (green, range of latencies as reported in the literature), and indirectly via auditory primary (TE1) and associative (TE3) cortex (blue, ranges of latencies from the literature). Both routes converge on the LA (red) with latencies that can be theoretically calculated taking into account the known thalamo-amygdala (5–8 ms, in green, producing N1) and cortico-amygdala (7–11 ms, in blue) latencies. From the TLPs observed in the present study in vivo, we can infer the latencies of the first TLPs resulting from intra-LAd recurrent network processing (in red). This shows that a temporal coincidence may occur between synaptic potentials resulting from LAd recurrent network processing (N2, N3, red) and cortically processed sensory signals through the cortical network (19–24 ms for the earliest, 27–41 ms at its peak, in blue).

Similar articles

Cited by

References

    1. Armony J. L., Servan-Schreiber D., Romanski L. M., Cohen J. D., LeDoux J. E. (1997). Stimulus generalization of fear responses: effects of auditory cortex lesions in a computational model and in rats. Cereb. Cortex 7, 157–16510.1093/cercor/7.2.157 - DOI - PubMed
    1. Bauer E. P., LeDoux J. E. (2004). Heterosynaptic long-term potentiation of inhibitory interneurons in the lateral amygdala. J. Neurosci. 24, 9507–951210.1523/JNEUROSCI.3567-04.2004 - DOI - PMC - PubMed
    1. Bi G., Poo M. (2001). Synaptic modification by correlated activity: Hebb's postulate revisited. Annu. Rev. Neurosci. 24, 139–16610.1146/annurev.neuro.24.1.139 - DOI - PubMed
    1. Blair H. T., Schafe G. E., Bauer E. P., Rodrigues S. M., LeDoux J. E. (2001). Synaptic plasticity in the lateral amygdala: a cellular hypothesis of fear conditioning. Learn. Mem. 8, 229–24210.1101/lm.30901 - DOI - PubMed
    1. Bolam J. P., Clarke D. J., Smith A. D., Somogyi P. (1983). A type of aspiny neuron in the rat neostriatum accumulates [3H]gamma-aminobutyric acid: combination of Golgi-staining, autoradiography, and electron microscopy. J. Comp. Neurol. 213, 121–13410.1002/cne.902130202 - DOI - PubMed

LinkOut - more resources