. 2009 Mar;49(3):920-9.
doi: 10.1002/hep.22705.

Foxl1 is a marker of bipotential hepatic progenitor cells in mice

Affiliations

Foxl1 is a marker of bipotential hepatic progenitor cells in mice

Sara D Sackett et al. Hepatology. 2009 Mar.

Abstract

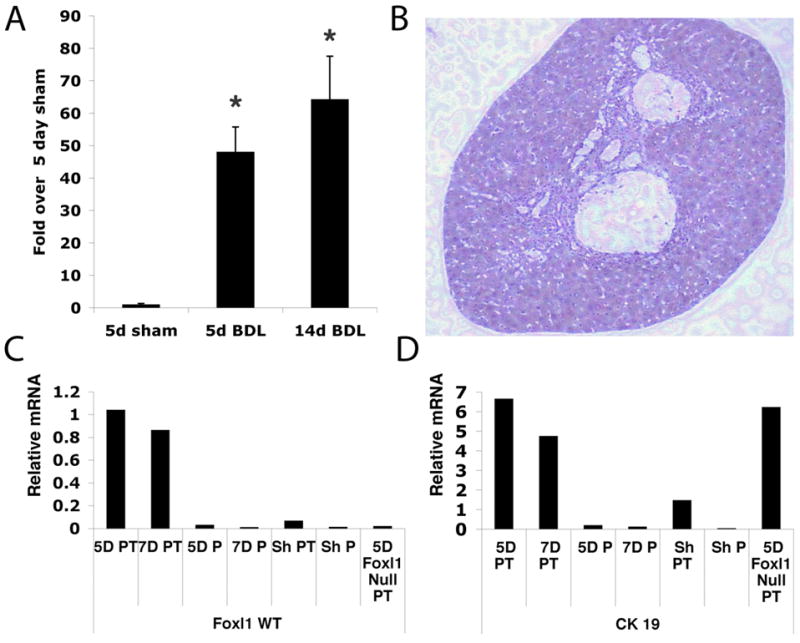
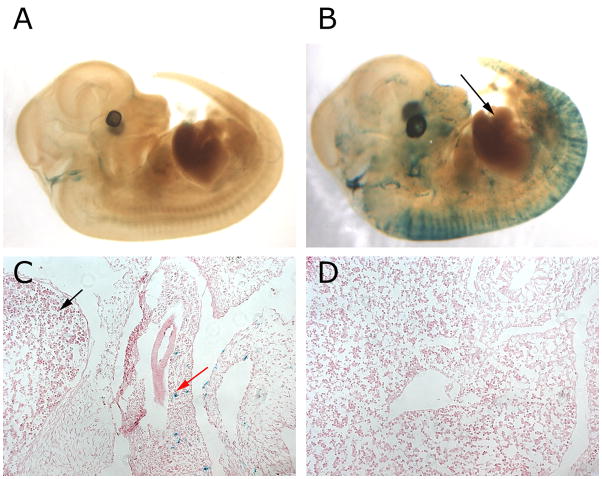
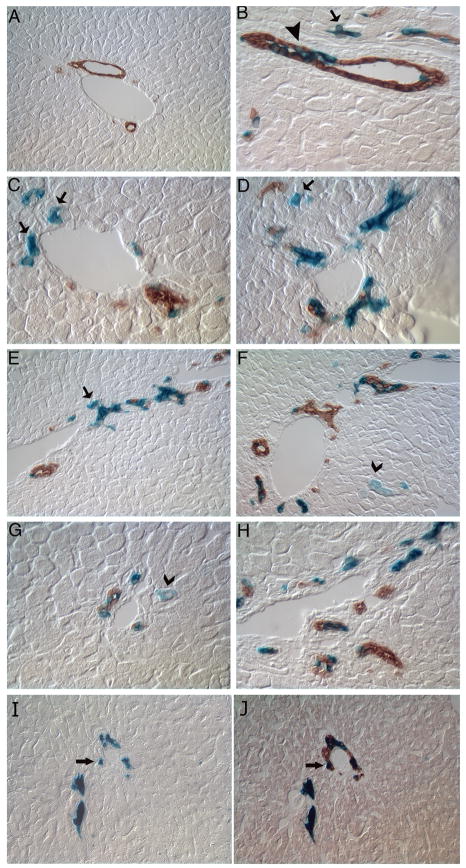
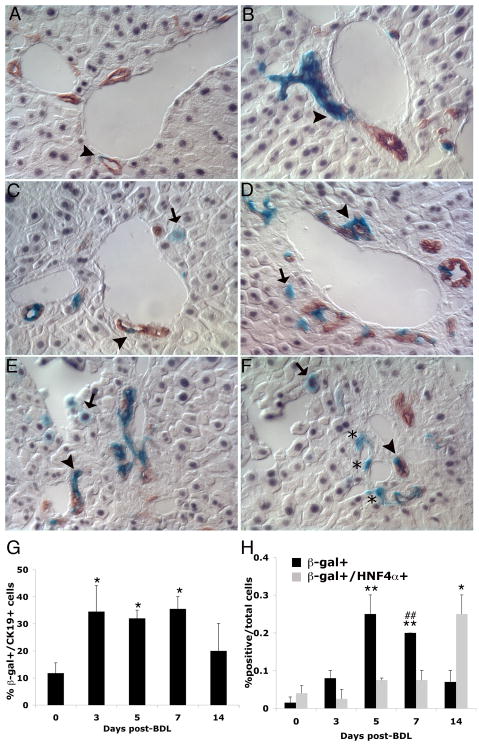
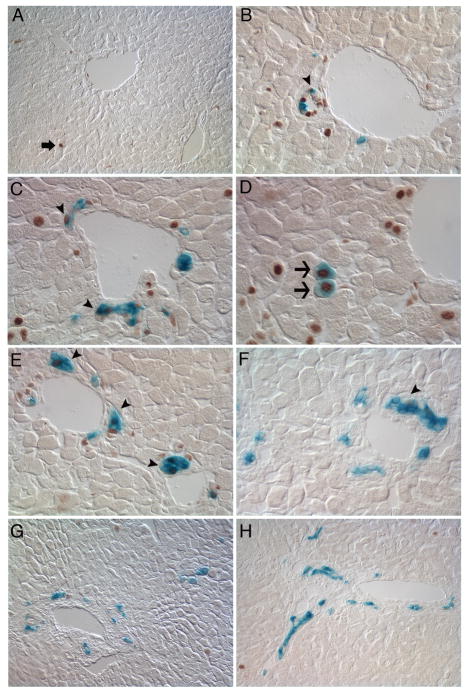
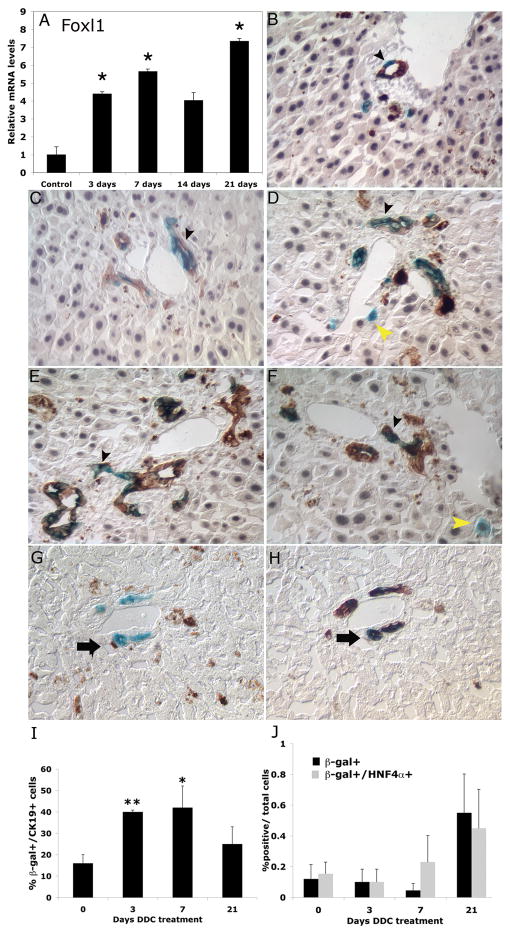
The liver contains a population of small bipotential facultative progenitor cells that reconstitute liver function when mature hepatocytes or cholangiocytes are unable to proliferate. Mesenchymal markers, including members of the forkhead transcription factor gene family, have been detected in hepatic progenitor cells. The winged helix transcription factor Foxl1 localizes to mesenchymal cells in the intestine; however, its expression in the liver has not been reported. We found that Foxl1 is expressed in rare cells in the normal liver but is dramatically induced in the livers of mice that have undergone bile duct ligation or were fed a 3,5-diethoxycarbonyl-1,4-dihydrocollidine (DDC)-containing or choline-deficient, ethionine-supplemented diet. In addition, we employed genetic lineage tracing using a Foxl1-Cre transgenic mouse crossed with the Rosa26R lacZ reporter line to demonstrate that Foxl1-Cre-expressing cells are present within the periportal region shortly after injury. These cells give rise to both hepatocytes [marked by hepatocyte nuclear factor 4 alpha (HNF-4alpha) expression] and cholangiocytes (marked by CK19 expression), indicating that these cells are derived from Foxl1-Cre-expressing cells. Foxl1-Cre-expressing cells are distinct from hepatic stellate cells, portal fibroblasts, and myofibroblasts, although they are located in close proximity to portal fibroblasts. These results demonstrate that the early Foxl1-Cre lineage cell gives rise to both cholangiocytes and hepatocytes after liver injury and suggest the potential for progenitor-portal fibroblast cell interactions.

Conclusion: We propose that Foxl1 is a bona fide marker of the facultative progenitor cell in the mouse liver.


Figures

Figure 1
Figure 1. Foxl1 expression is induced following cholestatic liver injury
A) Expression of Foxl1 mRNA was significantly increased in livers 5 and 14 days following bile duct ligation (BDL). 5 day (n=4), 2 week (n=4), WT sham n=2. *P-value < 0.02. (B–D) Laser capture microdissection of liver tissue following BDL detects Foxl1 mRNA in portal tracts but not the liver parenchyma. Portal tracts and adjacent parenchyma of Foxl1 WT livers following 3, 5 and 7 day BDL, Foxl1 null 5 day BDL and 7 day sham WT BDL were microdissected and RNA isolated for gene expression analysis. (B) Representative portal tract isolated by laser capture microdissection for gene expression analysis. (C) qRT-PCR for Foxl1 establishes that Foxl1 is expressed in the portal tract but not liver parenchyma of BDL mice. Portal tracts of Foxl1 null mice or sham-operated animals did not express Foxl1. (D) qRT-PCR confirmed expression of the bile duct marker CK19 in portal tracts but not in surrounding parenchyma of livers after BDL. Abbreviations, WT (Wild type), PT (Portal Tract), P (Parenchyma), Sh (Sham).
Figure 2
Figure 2. Foxl1-Cre does not mark fetal hepatoblasts
β-gal staining of Rosa26R control embryo (A) and Foxl1-Cre; Rosa26R embryos (B–D) at day 12.5 of gestation. A) Control embryo with only some blue staining near the otic vesicle. B) Foxl1-Cre; Rosa26R embryo with β-gal positive cells in the developing spinal cord, but none in the liver (marked by black arrow). C) Section of a 12.5 dpc Foxl1-Cre; Rosa26R embryo, showing β-gal positive cells in the gastrointestinal mesenchyme (red arrow) but not in the liver (black arrow). D) Another view of the embryo sectioned in C, showing that there are no blue cells present in the liver, indicating that the Foxl1-Cre transgene is not active in fetal hepatoblasts.
Figure 3
Figure 3. Lineage tracing of Foxl1-positive cells following bile duct ligation
Foxl1Cre; Rosa26RlacZ mice underwent BDL and livers were harvested 3, 5, 7 and 14 days later. Livers were analyzed for β-gal activity reflecting Foxl1-Cre activation (blue) and co-stained with the cholangiocyte marker CK19 (brown). We observed a steady increase in the number of β-gal positive cells over time, which were seen as early as 3 days in β-gal+/CK19+ co-labeled bile ductular cells (arrowhead) and β-gal+/CK19 cells in periportal regions (arrow). By 5 days (C, D) and 7 days (E, F) we found increasing numbers of β-gal+/CK19 cells (arrow) in periportal regions and the emergence of β-gal stained cells with the morphologic appearance of hepatocytes (F, G, chevron arrow). Figure (A) 5 day sham, 20× magnification, (B) 3 day BDL 40× magnification, (C, D) 5 day BDL 40× magnification, (E, F) 7 day BDL 20× magnification, (G,H) 14 day BDL, 40× magnification. Sequential stain of 14 day BDL at 20× magnification with β-gal (I) followed by CK19 (J). Representative β-gal+/CK19+ cells are indicated by arrows.
Figure 4
Figure 4. Lineage tracing of Foxl1-Cre-positive cells following bile duct ligation
Triple labeling for β-gal, CK19 and HNF4α allowed the identification of Foxl1-Cre-lineage positive cholangiocytes (β-gal/CK19 double positive cells) and hepatocytes (β-gal/HNF-4α double positive cells). Liver cells were identified with the hepatocyte marker HNF4α (grey) and cholangiocyte marker CK19 (brown), and Foxl1-Cre-positive cells and their descendants by β-gal staining (blue). Rare double-labeled β-gal/CK19 cells appeared in sham operated livers (A) and were frequently observed in ductular reactions beginning at 3 days post-BDL and throughout the time course examined (B–F, arrowhead). Single-labeled β-gal positive cells in the 14 day BDL liver (Panel F) are identified by asterisk. Double labeled β-gal/HNF-4α hepatocytes are shown in day 5 post-BDL livers (arrows in C, D, and E). (A) Sham-operated, (B) 3 day BDL, (C) 5 day BDL, (D) 7 day BDL, (E, F) 14 day BDL, 40× magnification. Quantification of percent β-gal+/CK19+ cells (G) and percent β-gal+ and β-gal+HNF-4α+/total cells at indicated time points post-BDL (H). *p-value < 0.05 relative to control, **p-value <0.001 relative to control. ##p-value < 0.05 percent β-gal+/total cells relative to β-gal+/HNF-4α+/total cells 7 day BDL.
Figure 5
Figure 5. The Foxl1-Cre-positive cell lineage is enriched for proliferating cells
β-gal and Ki-67 double-labeling reveals co-localization of β-gal and Ki-67 (brown labeled nuclei), indicating that Foxl1-Cre positive cells are actively proliferating following BDL injury. Only rare Ki-67 positive hepatocytes are detected in sham-operated livers (A, arrow). In the 3-day BDL liver (B, arrowhead)), Ki-67 and β-gal co-localized in cells within bile ductules. Co-localization of Ki-67 and β-gal in 5 (C) and 7-day BDL livers (E) was detected in ductular reactions (arrowheads). Dual stained β-gal/Ki-67 cells with hepatocyte morphology were seen in 5 day BDL (D, arrows). By 14 days post-BDL, the majority of β-gal cells were Ki-67 negative (F–H). (A) sham, 20×, (B) 3 d BDL, 40× (C, D) 5 d BDL 40×, (E) 7 d BDL (40×) and, (F) 14 d BDL, 40×, (G–H), 14 d BDL, 20× magnification.
Figure 6
Figure 6. The Foxl1-Cre-positive lineage in DDC-treated mice
(A) Expression of Foxl1 mRNA was significantly increased in livers of mice fed a diet containing 0.01% DDC. Triple label staining of liver sections of Foxl1-Cre; Rosa26RlacZ mice: β-gal (blue), CK19 (brown) and HNF-4α (gray) 3 days (B), 7 days (C), 14 days (D), or 21 days (E, F) after treatment with a DDC-containing diet. Cells within ductular reactions were co-labeled with β-gal and CK19 beginning 3 days after initiation of DDC diet (B, black arrowhead) and detected throughout the 21-day timecourse (C–F). Co-localization of β-gal and HNF4-α is detected in 14 day and 21 day DDC diet livers (yellow arrowhead, D, F). Brown background staining represents heme-containing breakdown products of DDC. Quantitation of percent β-gal+/CK19+ cells (G) and percent β-gal+ and β-gal+HNF-4α+/total cells (H). *p-value < 0.05 relative to control, **p-value <0.01 relative to control. Sequential stain of 21 day DDC 20× magnification with β-gal (I) followed by CK19 (J). Representative β-gal+/CK19+ cells are indicated by arrows.
Figure 7
Figure 7. Foxl1-Cre does not co-localize with myofibroblastic cell markers in the DDC injury paradigm
β-gal/desmin, β-gal/elastin and β-gal/α-SMA co-staining in control (A, C, E) and 21 day DDC diet treated mice (B, D,F). β-gal staining appears aqua blue, while desmin, elastin and SMA are shown as royal blue pseudocolorization of the original immunofluorescence images. Elastin, α-SMA and desmin staining in control livers were confined to perivascular cells (A, C, E). Elastin positive cells were observed in close proximity to, but not overlapping with the β-gal positive cells in DDC fed mice (B, arrow). There was minimal expression of desmin and α-SMA in the DDC injured livers (D, F). 20× magnification.

References

    1. Gualdi R, Bossard P, Zheng M, Hamada Y, Coleman JR, Zaret KS. Hepatic specification of the gut endoderm in vitro: cell signaling and transcriptional control. Genes Dev. 1996;10:1670–1682. - PubMed
    1. Michalopoulos GK, DeFrances MC. Liver regeneration. Science. 1997;276:60–66. - PubMed
    1. Ponfick V. Ueber leberresection und leberreaction. Verhandl Deutsch Gesellesch Chir. 1890:19.
    1. Shiojiri N. Analysis of differentiation of hepatocytes and bile duct cells in developing mouse liver by albumin immunofluorescence. Dev Growth Differ. 1984;26:555–561. - PubMed
    1. Shiojiri N, Inujima S, Ishikawa K, Terada K, Mori M. Cell lineage analysis during liver development using the spf(ash)-heterozygous mouse. Lab Invest. 2001;81:17–25. - PubMed

Publication types

MeSH terms