. 2008 Dec 23:2:110.
doi: 10.1186/1752-0509-2-110.

Essential operating principles for tumor spheroid growth

Affiliations

Essential operating principles for tumor spheroid growth

Jesse A Engelberg et al. BMC Syst Biol. .

Abstract

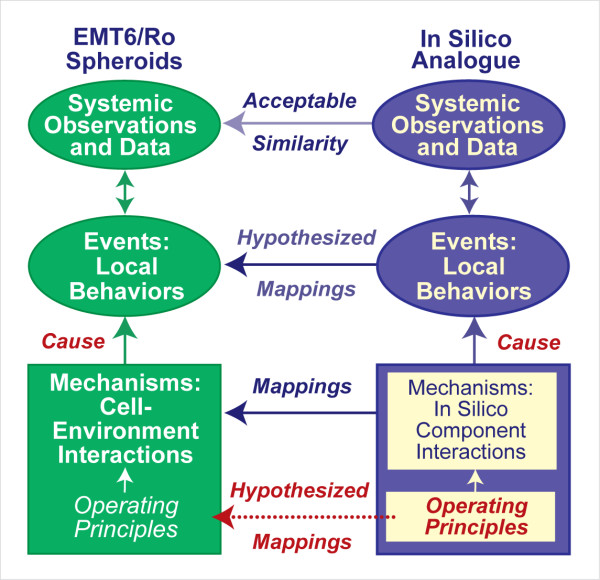
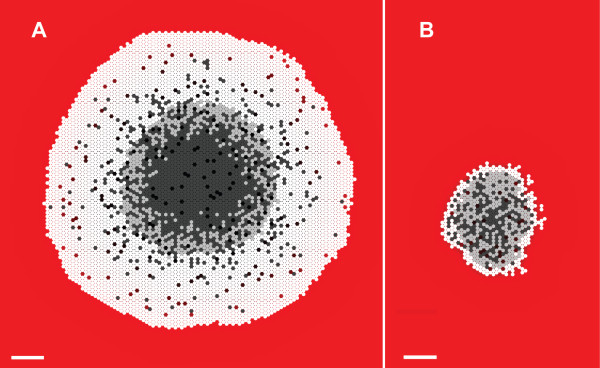
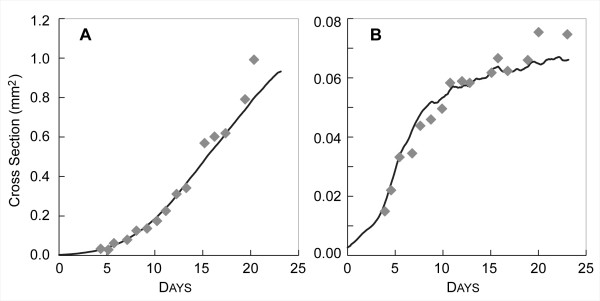
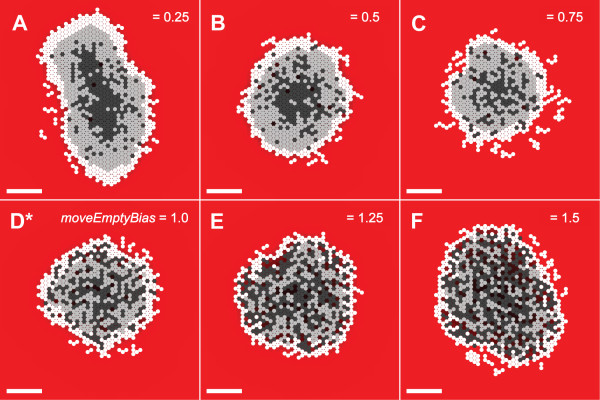
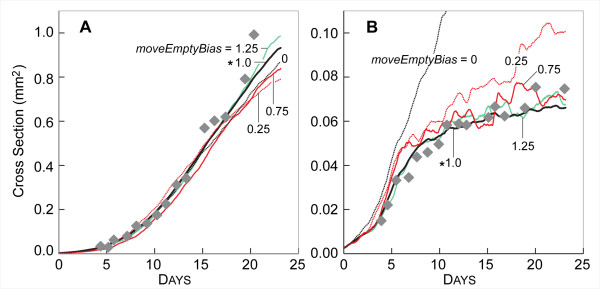
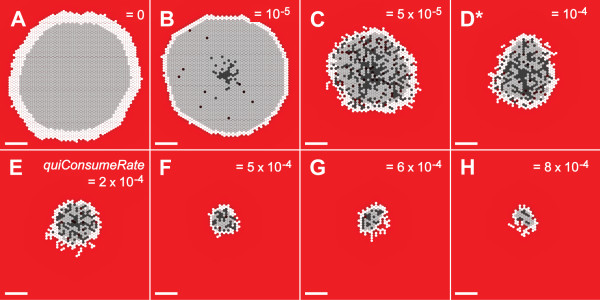
Background: Our objective was to discover in silico axioms that are plausible representations of the operating principles realized during characteristic growth of EMT6/Ro mouse mammary tumor spheroids in culture. To reach that objective we engineered and iteratively falsified an agent-based analogue of EMT6 spheroid growth. EMT6 spheroids display consistent and predictable growth characteristics, implying that individual cell behaviors are tightly controlled and regulated. An approach to understanding how individual cell behaviors contribute to system behaviors is to discover a set of principles that enable abstract agents to exhibit closely analogous behaviors using only information available in an agent's immediate environment. We listed key attributes of EMT6 spheroid growth, which became our behavioral targets. Included were the development of a necrotic core surrounded by quiescent and proliferating cells, and growth data at two distinct levels of nutrient.

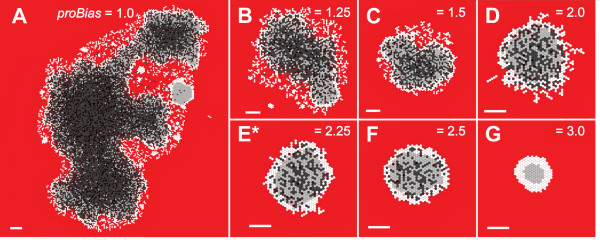
Results: We then created an analogue made up of quasi-autonomous software agents and an abstract environment in which they could operate. The system was designed so that upon execution it could mimic EMT6 cells forming spheroids in culture. Each agent used an identical set of axiomatic operating principles. In sequence, we used the list of targeted attributes to falsify and revise these axioms, until the analogue exhibited behaviors and attributes that were within prespecified ranges of those targeted, thereby achieving a level of validation.

Conclusion: The finalized analogue required nine axioms. We posit that the validated analogue's operating principles are reasonable representations of those utilized by EMT6/Ro cells during tumor spheroid development.


Figures

Figure 1
Figure 1
Relationships between simulated multicellular tumor spheroids (SMS) and EMT6 spheroids. An SMS is comprised of quasi-autonomous cell components interacting with adjacent cells and factors in their environment by adhering to a set of axiomatic operating principles. A clear mapping exists between SMS components and EMT6 counterparts. Following execution, the interacting components cause local and systemic behaviors. Measures of cell and system behaviors provide a set of attributes – the SMS phenotype. Validation was achieved when SMS attributes were measurably similar to a targeted set of EMT6 attributes. When that was accomplished, we could hypothesize that a semiquantitative mapping exists between in silico and in vitro events. We could also hypothesize that the set of axiomatic operating principles has a biological counterpart.
Figure 2
Figure 2
SMS cross-sections at 17 DAYS. Scale bar: 100 μm. Parameter values were those listed in Table 2. White circles: proliferating CELLS; light gray circles: quiescent CELLS; dark gray circles: NECROTIC CELLS. The background gradient (from red to black) represents NUTRIENT levels relative to the maximum value in red. (A) Growth occurred at high NUTRIENT, which maps to 0.28 mM oxygen and 16.5 mM glucose. (B) Growth occurred at low NUTRIENT, which maps to 0.08 mM oxygen and 0.8 mM glucose.
Figure 3
Figure 3
EMT6 and SMS growth curves. In vitro growth values (gray diamonds) were adapted from [13] by calculating spheroid diameters from measured volumes, assuming a circular cross-section. SMS values were obtained by specifying that CELL diameter maps to 10 μm, measuring the greatest X, Y extents, excluding isolated CELLS, and assuming a circular cross-section. Parameter values were those listed in Table 2. (A) SMS growth at high NUTRIENT. Values are means of ten runs. EMT6 spheroid values were from [13] at 0.28 mM oxygen and 16.5 mM glucose. (B) SMS growth was under low NUTRIENT. Values are means of ten runs. EMT6 spheroid values from [13] at 0.07 mM oxygen and 0.8 mM glucose.
Figure 4
Figure 4
SMS cross-sections at varied proBias values and low NUTRIENT. All images were recorded at 18 DAYS. Scale bar: 100 μm. Other parameter values were as listed in Table 2. (A)-(G) proBias values are shown. *: proBias value in Table 2.
Figure 5
Figure 5
An SMS cross-section at 67 DAYS at high NUTRIENT level. SMS shape is no longer circular. Scale bar 100 μm. Parameter values were those listed in Table 2.
Figure 6
Figure 6
SMS cross-sections at varied moveEmptyBias values and low NUTRIENT. All images were recorded at 21 DAYS. Scale bar: 100 μm. Other parameter values were as listed in Table 2. (A)-(F) moveEmptyBias values are shown. *: moveEmptyBias value in Table 2. Cross-sections at moveEmptyBias = 0 are not shown because they grew too quickly and filled the available space before 21 DAYS elapsed. As moveEmptyBias increased, more empty spaces were visible within the SMS.
Figure 7
Figure 7
Influence of moveEmptyBias on SMS growth. Gray diamonds: in vitro data as in Fig. 3. Other parameter values were those listed in Table 2. Colored lines are results of single experiments for the indicated values of moveEmptyBias from 0 to 1.5 (moveEmptyBias = 0 plus the same values as in Fig. 6). (A) high NUTRIENT; (B) low NUTRIENT. *: moveEmptyBias value in Table 2.
Figure 8
Figure 8
SMS cross-sections at varied quiConsumeRate and low NUTRIENT. All images were recorded at 13 DAYS. Scale bar: 100 μm. Except for quiConsumeRate, parameter values were those listed in Table 2. (A)-(H) quiConsumeRate values are shown. *: quiConsumeRate value in Table 2.
Figure 9
Figure 9
Influence of quiConsumeRate on SMS growth. Gray diamonds: in vitro data as in Fig. 3. Other parameter values were those listed in Table 2. Colored lines are results of single experiments for the indicated values of quiConsumeRate from 0 to 8.0 × 10⁻⁴ (same values as in Fig. 8). (A) high NUTRIENT; (B) low NUTRIENT. *: quiConsumeRate value in Table 2.
Figure 10
Figure 10
SMS cross-sections at varied proNut and low NUTRIENT. All images were recorded at 18 DAYS. Scale bar: 100 μm. Other parameter values were those listed in Table 2. (A)-(H)proNut values are shown. *:proNut value in Table 2. Note that while size increased initially with increasing proNut (a consequence of increased numbers of lower-consumption rate quiescent CELLS), larger proNut values caused the proliferating rim to become so thin that the SMS destabilized. The more quickly CELLS that are incapable of proliferating transition to the (lower-consumption) QUIESCENT state, the larger the size of the stable SMS.
Figure 11
Figure 11
Influence of proNut on SMS growth. Gray diamonds: in vitro data as in Fig. 3. Other parameter values were those listed in Table 2. Colored lines are results of single experiments for the indicated values of proNut from 8.0 × 10⁻⁴ to 7.0 × 10⁻³ (same values as in Fig. 10). (A) high NUTRIENT; (B) low NUTRIENT. *: proNut value in Table 2.
Figure 12
Figure 12
Influence of proBias on SMS growth. Gray diamonds: in vitro data as in Fig. 3. Other parameter values were those listed in Table 2. Colored lines are results of single experiments for the indicated values of proBias from 0 to 3. (A) high NUTRIENT; (B) low NUTRIENT. *: proBias value in Table 2.
Figure 13
Figure 13
Illustration of a CELL determining its level of STRESS. (A) InitialStress is calculated based on the number of empty spaces. (B) The change in STRESS is calculated based on number of outside neighbors and their initialStress values, with some CELLS increasing in STRESS (black values), some decreasing (red values) and others staying the same (gray values). (C) STRESS is calculated by summing the value of initialStress and the change in the value of STRESS.
Figure 14
Figure 14
Illustration of CELLS responding to STRESS at low NUTRIENT. (A-C) Illustrations of STRESS levels at sequential time steps. Only CELLS at the surface are color-coded. STRESS levels: dark blue = -2, light blue = -1, green = 0, yellow = 1, orange = 2, and red = 3. (A) During one simulation cycle, the empty space below and to the left of the starred (*) CELL is adjacent to that CELL; the CELL then moves inward to fill that empty space. (B) During the next simulation cycle, the starred CELL has a low STRESS and so becomes likely to create a new CELL. The stress algorithm allows CELLS that have equivalent immediate neighborhoods, such as the CELLS labeled 1 and 2, to have different STRESS values. Because the neighbors of CELL 1 have higher initialStress values than the neighbors of CELL 2, CELL 1 will have a higher STRESS and be more likely to create a new CELL during the simulation. (C) During the third simulation cycle the starred CELL creates a new CELL, places it in the adjacent space, resulting in a return to initial conditions. (D-F): CELL state view at equivalent TIME steps.

References

    1. Webster's Third New International Dictionary, Unabridged. Springfield, MA: Merriam-Webster; 2002.
    1. Jiang Y, Pjesivac-Grbovic J, Cantrell C, Freyer J. A multiscale model for avascular tumor growth. Biophys J. 2005;89:3884–3894. doi: 10.1529/biophysj.105.060640. - DOI - PMC - PubMed
    1. Roose T, Chapman SJ, Maini PK. Mathematical models of avascular cancer. SIAM Review. 2007;49:179–208. doi: 10.1137/S0036144504446291. - DOI
    1. Araujo RP, McElwain DLS. A history of the study of solid tumour growth: the contribution of mathematical modelling. Bull Math Biol. 2004;66:1039–1091. doi: 10.1016/j.bulm.2003.11.002. - DOI - PubMed
    1. Grant MR, Mostov KE, Tlsty TD, Hunt CA. Simulating properties of in vitro epithelial cell morphogenesis. PLoS Comput Biol. 2006;2:e129. doi: 10.1371/journal.pcbi.0020129. - DOI - PMC - PubMed

Publication types