

arrayQualityMetrics--a bioconductor package for quality assessment of microarray data
- PMID: 19106121
- PMCID: PMC2639074
- DOI: 10.1093/bioinformatics/btn647
arrayQualityMetrics--a bioconductor package for quality assessment of microarray data
Abstract
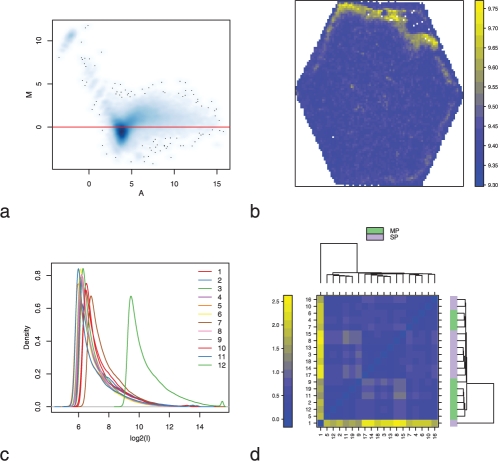
Summary: The assessment of data quality is a major concern in microarray analysis. arrayQualityMetrics is a Bioconductor package that provides a report with diagnostic plots for one or two colour microarray data. The quality metrics assess reproducibility, identify apparent outlier arrays and compute measures of signal-to-noise ratio. The tool handles most current microarray technologies and is amenable to use in automated analysis pipelines or for automatic report generation, as well as for use by individuals. The diagnosis of quality remains, in principle, a context-dependent judgement, but our tool provides powerful, automated, objective and comprehensive instruments on which to base a decision.
Availability: arrayQualityMetrics is a free and open source package, under LGPL license, available from the Bioconductor project at www.bioconductor.org. A users guide and examples are provided with the package. Some examples of HTML reports generated by arrayQualityMetrics can be found at http://www.microarray-quality.org
Figures
References
-
- Brettschneider J, et al. arXiv:0710.0178v2. 2007. Quality assessment for short oligonucleotide arrays.
-
- Buness A. array{M}agic: two-colour c{DNA} microarray quality control and preprocessing. Bioinformatics. 2005;21:554–556. - PubMed
-
- Dudoit S. Statistical methods for identifying differentially expressed genes in replicated cdna microarray experiments. Stat. Sinica. 2002;12:111–139.
-
- Dunning MJ. beadarray: R classes and methods for {I}llumina bead-based data. Bioinformatics. 2007;23:2183–2184. - PubMed
-
- Freue GVC, et al. MDQC: a new quality assessment method for microarrays based on quality control reports. Bioinformatics. 2007;23:3162–3169. - PubMed
Publication types
MeSH terms
Grants and funding
LinkOut - more resources
Full Text Sources
Other Literature Sources
Molecular Biology Databases
