Comparative Study
. 2009 Feb;16(1):31-44.
doi: 10.1093/dnares/dsn031. Epub 2008 Dec 23.

Cluster analysis and comparison of various chloroplast transcriptomes and genes in Arabidopsis thaliana

Affiliations
Comparative Study

Cluster analysis and comparison of various chloroplast transcriptomes and genes in Arabidopsis thaliana

Won Kyong Cho et al. DNA Res. 2009 Feb.

Abstract

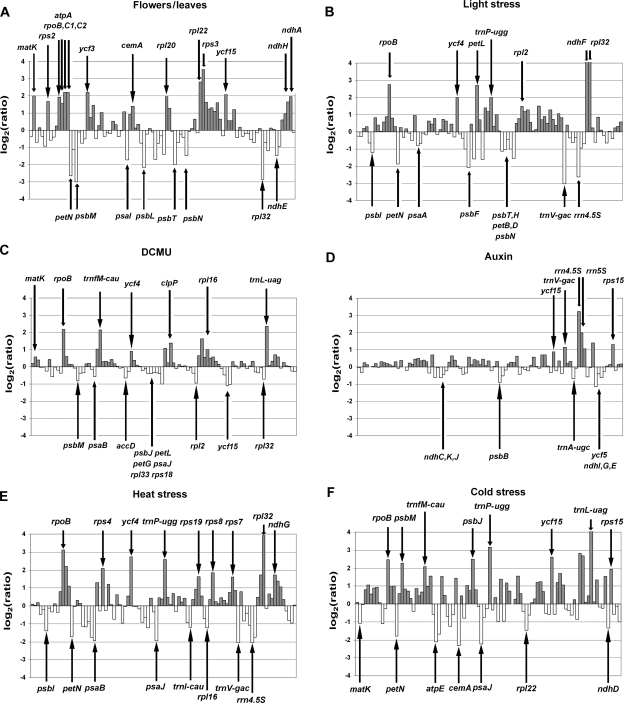
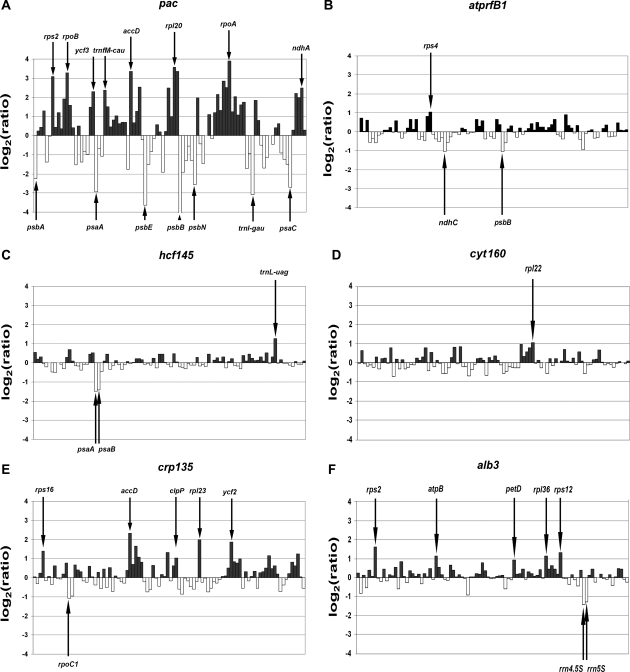
Chloroplast RNA metabolism is integrated into wider gene regulatory networks. To explore how, we performed a chloroplast genome-wide expression analysis on numerous nuclear Arabidopsis mutants affected in diverse chloroplast functions and wild-type plants subjected to various stresses and conditions. On the basis of clustering analysis, plastid genes could be divided into two oppositely regulated clusters, largely congruent with known targets of nucleus- and plastid-encoded RNA polymerases, respectively. Further eight sub-clusters contained co-transcribed and functionally tightly associated genes. The chloroplast transcriptomes could also be classified into two major groups comprising mutants preferentially affected in general plastid gene expression and other chloroplast functions, respectively. Deviations from characteristic expression profiles of transcriptomes served to identify novel mutants impaired in accumulation and/or processing of specific plastid RNAs. Expression profiles were useful to distinguish albino mutants affected in plastid gene expression from those with defects in other plastid functions. Remarkably, biotic and abiotic stressors did not define transcriptionally determined clusters indicating that post-transcriptional regulation of plastid gene expression becomes more important under changing environmental conditions. Overall, the identification of sets of co-regulated genes provides insights into the integration of plastid gene expression into common pathways that ensures a coordinated response.


Figures

Figure 1
Figure 1
Changes in plastid transcript levels in tissues and leaves exposed to the indicated stressors. (AF) Log2-transformed fold changes in plastid RNA levels were determined in flowers when compared with leaves (A), and in leaves subjected to high light stress (B), DCMU treatment (C), auxin treatment (D), heat (E) and cold stress (F) when compared with untreated control leaves. High expression ratios are indicated by arrows. Detailed information on the stress conditions employed is given in Supplementary Table S1. In all six histograms, genes are listed according to their positions on the plastid chromosome.
Figure 2
Figure 2
Plastid transcript levels in six representative nuclear mutants compared with WT. (AF) Log2-transformed fold changes in RNA levels in each mutant are expressed relative to WT. Up-regulated genes have positive, down-regulated genes negative values. Significantly deviating expression ratios are indicated by arrows. Adjusted P-values for each gene are listed in Supplementary Table S2. (A) pac, (B) atprfB1, (C) hcf145, (D) cyt160, (E) crp135 and (F) alb3.
Figure 3
Figure 3
Expression profiles of 94 plastid genes in 89 transcriptomes. (A) Transcript levels in 75 mutants and in WT plants exposed to 14 different biological conditions were determined by macroarray analysis. Fold change values were transformed to log2 and normalized relative to the mean value of genes and experiments. Non-hierarchical K-means clustering (K=2) was performed as described in the ‘Results’. Fold changes close to, higher and lower than the mean values are represented by black, red and green colors, respectively. Co-expressed plastid genes were distributed into two major clusters A and B, which were further divided into eight classes (A–H). Cluster A (green bar) and cluster B (red bar) contain each four classes. Detailed information can be found in Table 1 and Supplementary Table S3. (B) Average expression views of plastid genes in each class show eight distinct expression patterns of plastid genes in 89 transcriptomes. The colors used correspond to the classes in Fig. 3A. The mean expression pattern within each gene class is shown by the black line. The x- and y-axes represent the 89 transcriptomes and log2-transformed fold changes of plastid genes, respectively. The order of the transcriptomes is according to Fig. 3A. (C) Average expression views of plastid genes in clusters A (green) and B (red). The order of the 89 transcriptomes is identical to that shown in panel A. (D) Here, expression profiles were used to cluster the 89 transcriptomes rather than genes using non-hierarchical terrain clustering as described in the ‘Methods’. The terrain map is reminiscent of a model of a complex mountain ridge and illustrates the correlation of the 89 transcriptomes in three dimensions. The appearing clusters reflect individual mountains of specific size and shape depending on the number of and correlation between genes in that cluster, respectively. Peak height corresponds to the density of transcriptomes, denoted by red, yellow and green colors. The white cube on each peak indicates an individual transcriptome or a group of transcriptomes and neighboring peaks have similar expression profiles. The arrows indicate the two distinct transcriptome groups.
Figure 4
Figure 4
Northern analysis of the plastid genes clpP and accD in WT and crp135. Each lane was loaded with 10 µg of total leaf RNA isolated from 3-week-old mutant and WT seedlings that had been grown on sucrose-supplemented agar medium. Staining shows equal loading of RNAs and reduced levels of plastid rRNAs (23Sa, 23Sb, 16S) when compared with cytoplasmic rRNAs (25S, 18S). The numbers on the left indicate RNA sizes in bases. clpP (caseinolytic protease); accD (carboxyltransferase beta sub-unit of the acetyl-CoA carboxylase).
Figure 5
Figure 5
Expression map of 79 plastid genes under 83 various conditions generated from Genevestigator. (A) Hierarchical clustering identified six co-regulated gene clusters as illustrated by different color bars. Up-regulated, down-regulated and unchanged gene expressions are labeled by red, green and black colors, respectively. (B) The average expression views of plastid genes in each identified cluster are shown. The mean expression pattern within each cluster is shown by black color. The x- and y-axes represent 83 different stress conditions and log2-transformed fold changes of plastid genes, respectively.

References

    1. Barkan A., Goldschmidt-Clermont M. Participation of nuclear genes in chloroplast gene expression. Biochimie. 2000;82:559–572. - PubMed
    1. Rochaix J. D. Posttranscriptional control of chloroplast gene expression. From RNA to photosynthetic complex. Plant Physiol. 2001;125:142–144. - PMC - PubMed
    1. Gray J. C., Sullivan J. A., Wang J. H., Jerome C. A., MacLean D. Coordination of plastid and nuclear gene expression. Phil. Trans. R. Soc. Lond. B. 2002;358:135–145. - PMC - PubMed
    1. Nakamura T., Schuster G., Sugiura M., Sugita M. Chloroplast RNA-binding and pentatricopeptide repeat proteins. Biochem. Soc. Trans. 2004;32:571–574. - PubMed
    1. Tanaka K., Oikawa K., Ohta N., Kuroiwa H., Kuroiwa T., Takahashi H. Nuclear encoding of a chloroplast RNA polymerase sigma subunit in a red alga. Science. 1996;272:1932–1935. - PubMed

Publication types