

Gender-ethnic disparity in BMI and waist circumference distribution shifts in US adults
- PMID: 19107129
- PMCID: PMC2610345
- DOI: 10.1038/oby.2008.492
Gender-ethnic disparity in BMI and waist circumference distribution shifts in US adults
Abstract
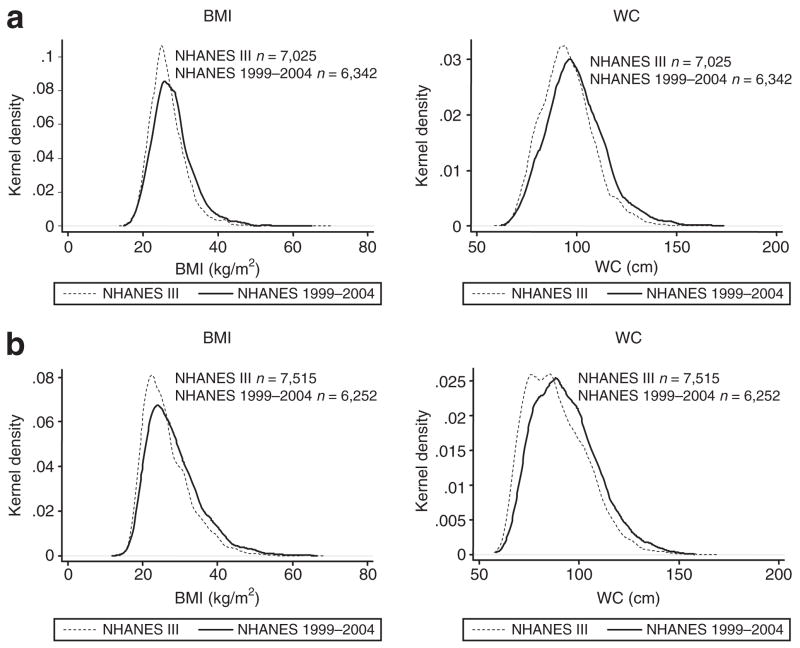
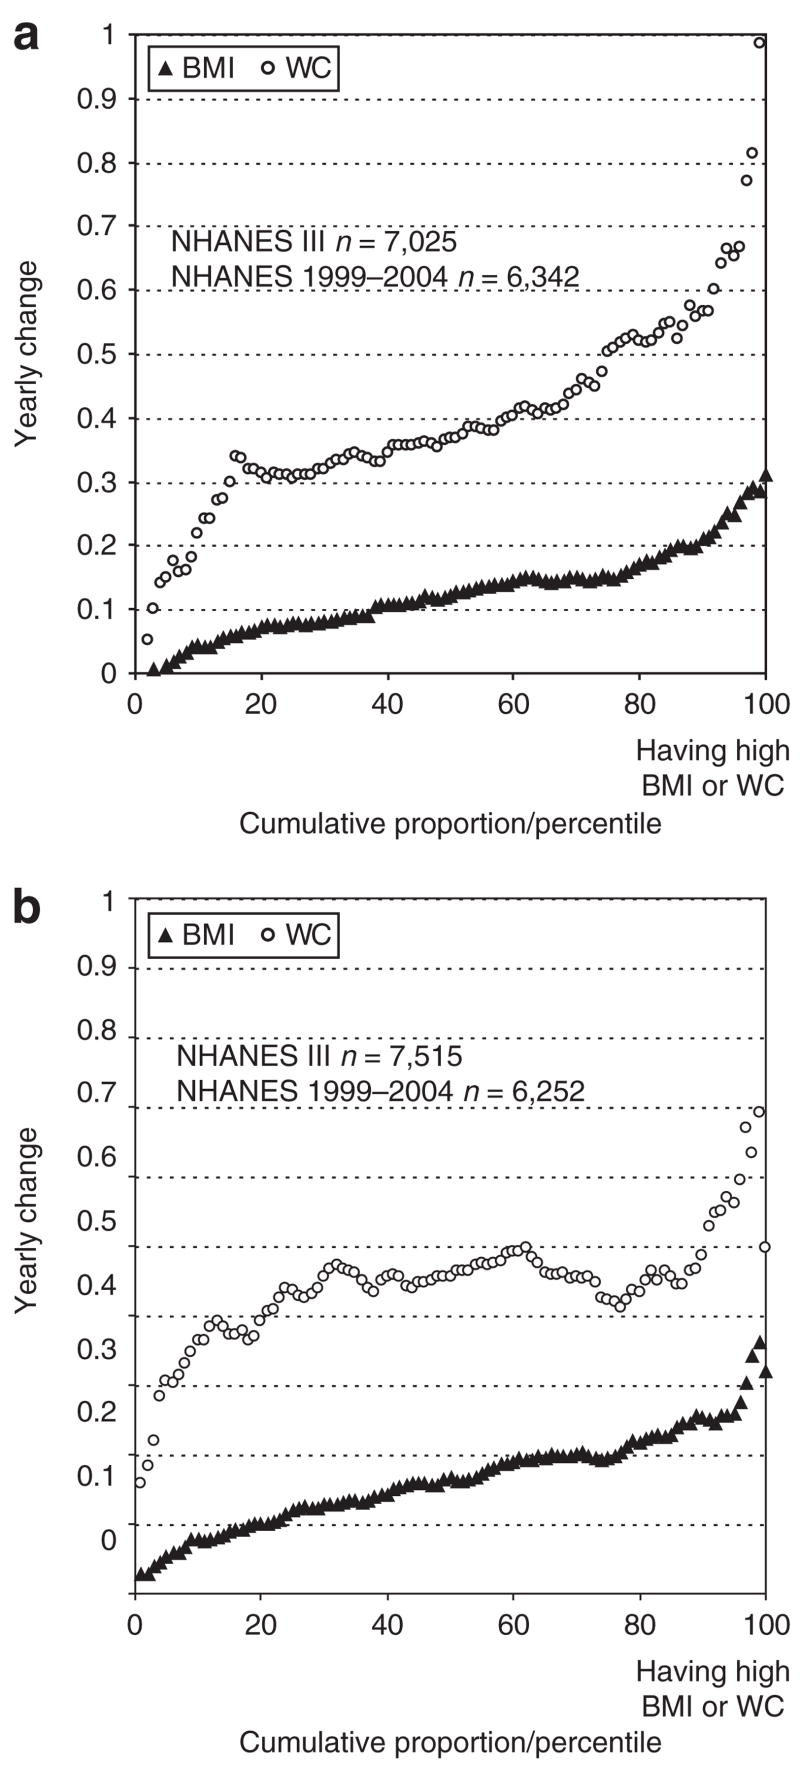
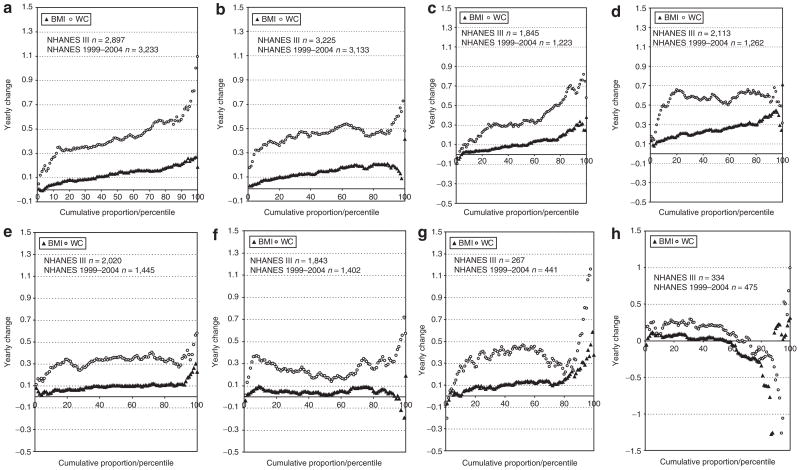
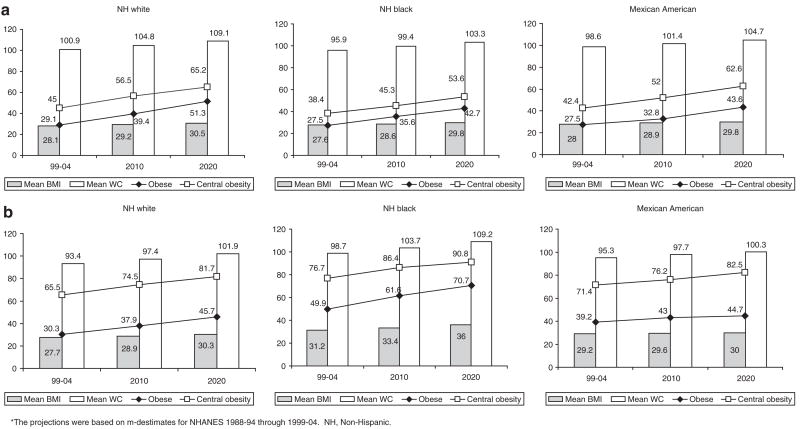
While obesity has been increasing in the United States, little is known about the variation in recent BMI and waist circumference (WC) distribution shifts across socio-demographic groups. We assessed shifts in BMI and WC distributions and compared between-group differences over the past decade, and projected future BMI and WC distributions and prevalence of obesity and central obesity using National Health and Nutrition Examination Survey (NHANES) 1988-1994 and 1999-2004 data. BMI/WC distributional shifts overall and in percentiles were compared across groups. Average yearly shift was calculated and used for projecting future distributions and prevalence. Both BMI and WC increased more in their uppermost percentile distribution, though BMI shift declined toward the uppermost percentiles among women. Heavier Americans gained more adiposity over the past decade. Ethnic (non-Hispanic (NH) white vs. black) disparities in mean BMI and WC became wider. Over the survey period, mean BMI increased by 1.3 units vs. 1.8 units among men and women, whereas WC, by 4.2 cm vs. 4.8 cm. Young adults had the largest increase. Shift in women's WC was stable between the 25th and 75th percentiles, but gained pace at higher WC, while women's BMI and men's BMI and WC shifts increased linearly. NH black women had the largest shifts and would have central obesity and obesity prevalence of 90.8 and 70.7% by 2020. Shifts in BMI and WC distribution varied across age-, gender-, and ethnic groups. Future rise in the obesity and central obesity prevalence rates are expected, but would vary by demographic groups.
Conflict of interest statement
DISCLOSURE
The authors declared no conflict of interest.
Figures
References
-
- Wang Y, Beydoun MA. The obesity epidemic in the United States—gender, age, socioeconomic, racial/ethnic, and geographic characteristics: a systematic review and meta-regression analysis. Epidemiol Rev. 2007;29:6–28. - PubMed
-
- WHO Expert Committee. Technical Report Series 54. WHO; Geneva: 1995. Physical status, the use and interpretation of anthropometry. - PubMed
-
- World Health Organization (WHO) Technical report series 894. WHO: Geneva; 2000. Obesity: preventing and managing the global epidemic: Report of a WHO consultation. - PubMed
-
- National Institute of Health (NIH) NH, Lung, and Blood Institute’s (NHLBI), North American Association for the Study of Obesity (NAASO) The practical guide: Identification, Evaluation, and Treatment of Overweight and Obesity in Adults. NIH; Bethesda, MD: 2000.
-
- Wang Y, Rimm EB, Stampfer MJ, Willett WC, Hu FB. Comparison of abdominal adiposity and overall obesity in predicting risk of type 2 diabetes among men. Am J Clin Nutr. 2005;81:555–563. - PubMed
Publication types
MeSH terms
Grants and funding
LinkOut - more resources
Full Text Sources
Medical
Miscellaneous
