. 2009 Feb;27(1):40-9.
doi: 10.1080/08977190802625179.

Inhibition of histone deacetylases antagonized FGF2 and IL-1beta effects on MMP expression in human articular chondrocytes

Affiliations

Inhibition of histone deacetylases antagonized FGF2 and IL-1beta effects on MMP expression in human articular chondrocytes

Xibin Wang et al. Growth Factors. 2009 Feb.

Abstract

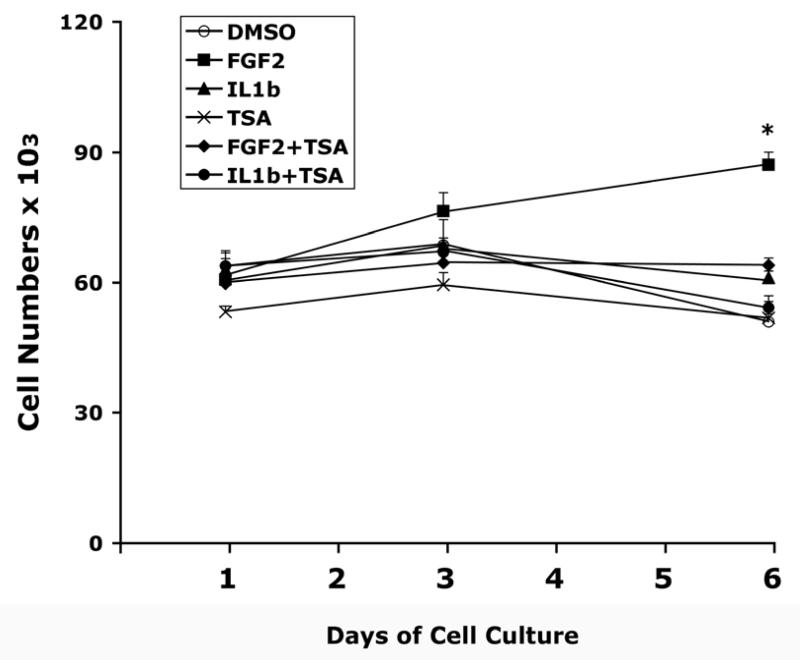
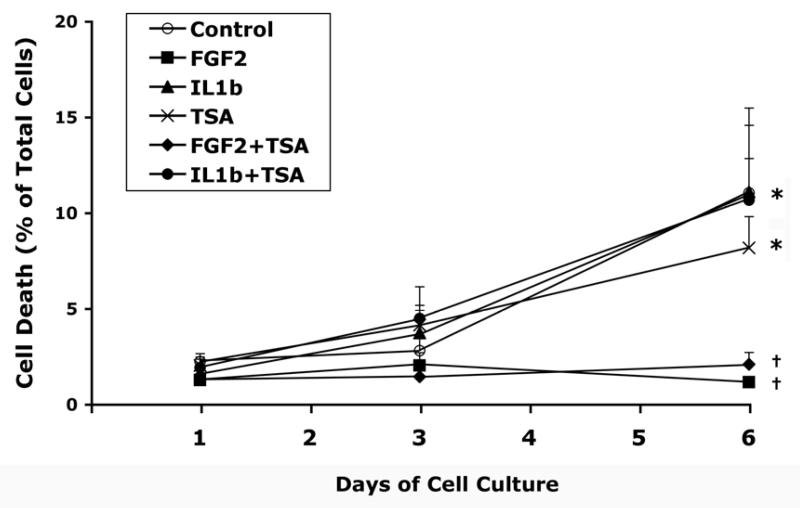
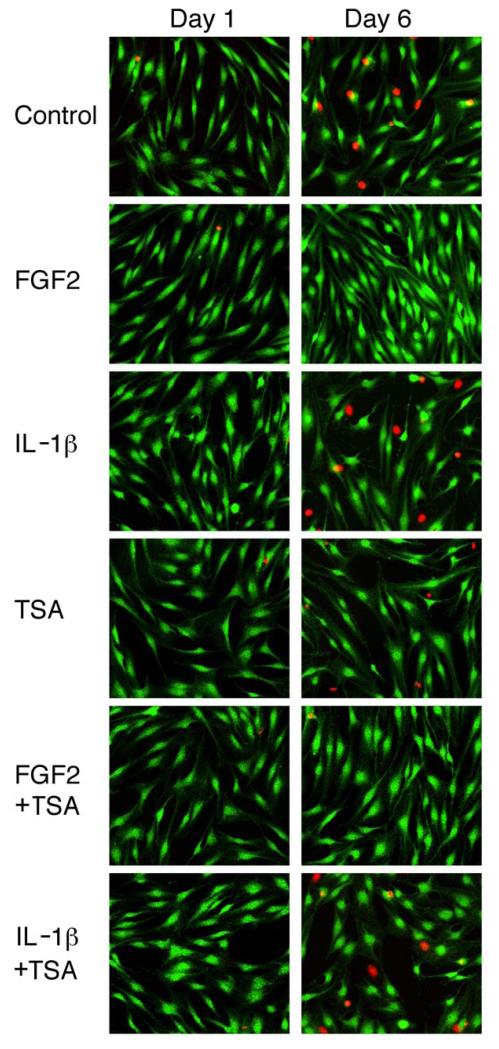
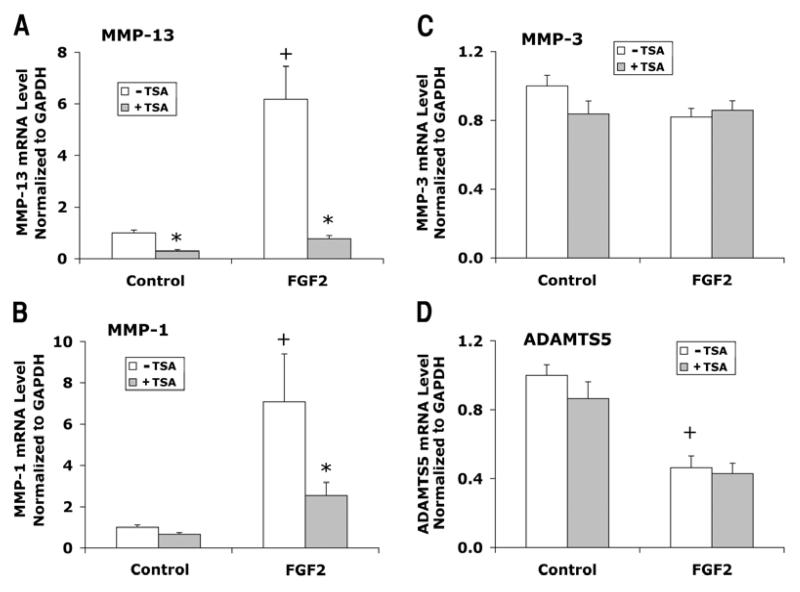
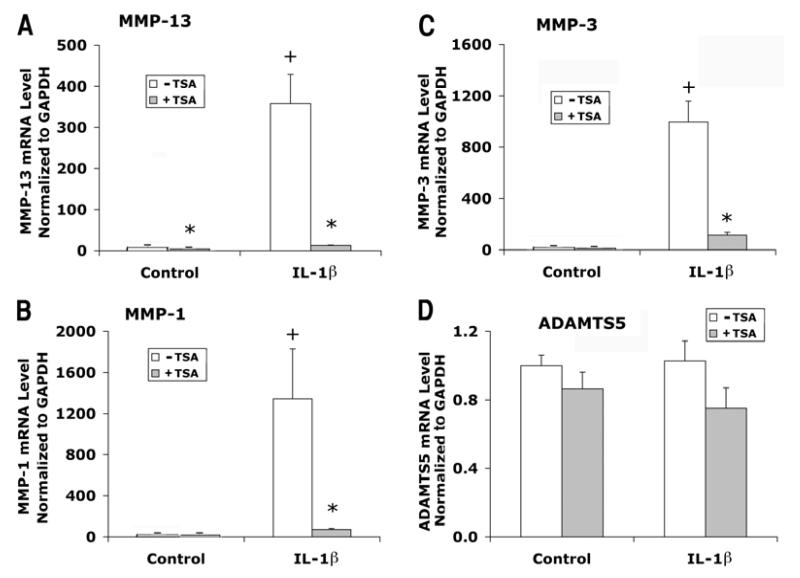
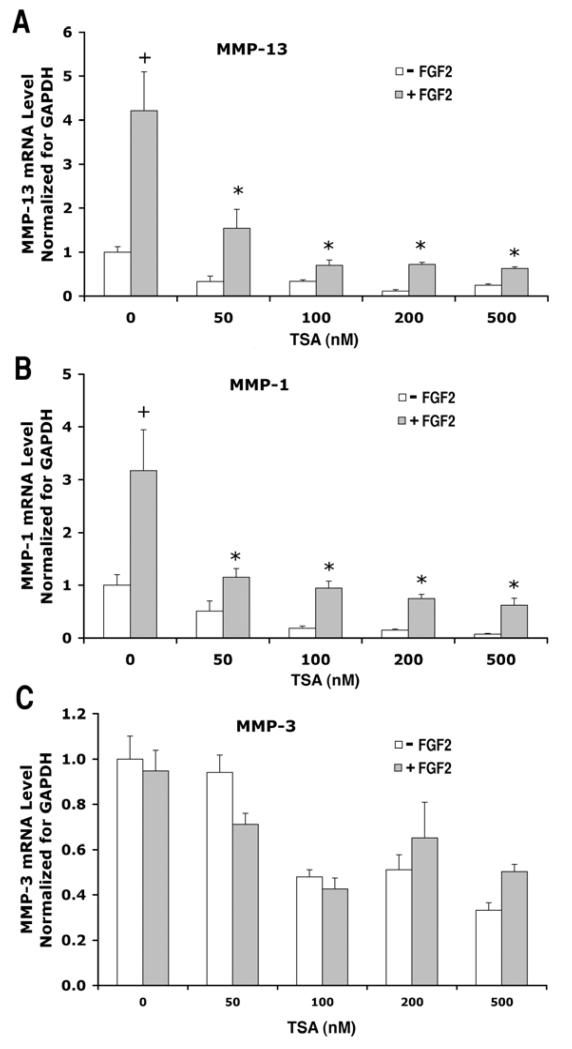
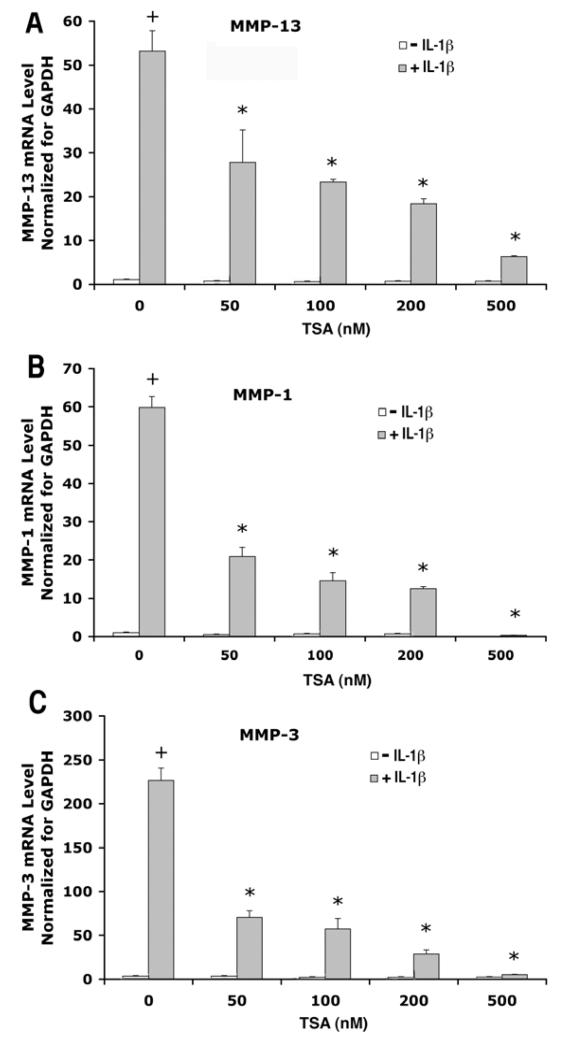
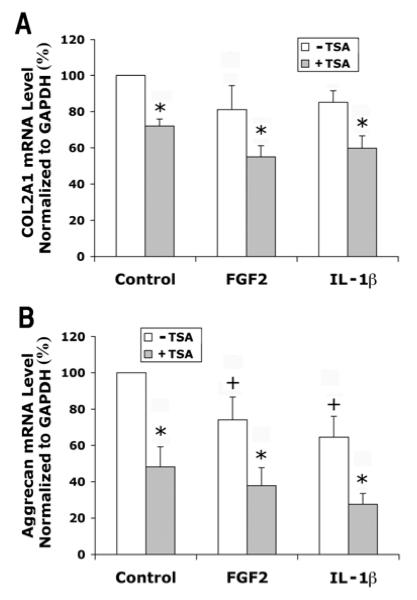
Fibroblast growth factor-2 (FGF2) and interleukin-1beta (IL-1beta) stimulate the expression of matrix metalloproteinases (MMPs) in articular chondrocytes, which may contribute to cartilage degradation and development of osteoarthritis. Histone deacetylases (HDACs) have recently been implicated in the regulation of MMP gene expression. To investigate the functional involvement of HDACs in the signaling pathway of FGF2 and IL-1beta, we examined the effects of HDAC inhibition on activities of FGF2 or IL-1beta on gene expression of MMP-1, MMP-3, MMP-13, a disintegrin and metalloproteinase with thrombospondin motifs-5 (ADAMTS5), collagen type II, and aggrecan. Human articular chondrocyte cultures were treated with FGF2 or IL-1beta in the presence or absence of HDAC inhibitor (trichostatin A, TSA). Gene expression levels after treatments were assessed using quantitative real time PCR. Results showed that FGF2 and IL-1beta both increased MMP-1 and -13 expression, while IL-1beta also increased MMP-3 mRNA levels. These effects were attenuated in the presence of TSA in a dose dependent manner. In contrast to the effects on MMPs, FGF2 decreased mRNA levels of ADAMTS-5, which was not affected by HDAC inhibition. FGF2, IL-1beta, and TSA inhibited expression of aggrecan, while TSA also decreased mRNA levels of collagen type II. These findings showed that HDAC inhibition antagonized FGF2 and IL-1beta induced MMP expression. Combination of FGF2 and the HDAC inhibitor decreases both anabolic and catabolic genes, which may slow the cartilage turnover and be beneficial for maintaining cartilage integrity.


Figures

Figure 1
Figure 1
Time course of cell growth in human articular chondrocyte cultures. Cells were cultured in 12-well culture plates with 1% FBS DMEM/F12 medium. Triplicate wells received treatment with FGF2 (25 ng/ml) and IL-1β (5 ng/ml) in the presence or absence of TSA (200 nM) for 1, 3, or 6 days. Cells were harvested by trypsinization and cell numbers were counted with a Coulter Z-1 particle counter. Data represent mean ± SEM from two separate experiments. Control: DMSO vehicle. *, p<0.05, when compared to the group at day 1 receiving the same treatment.
Figure 2
Figure 2
Time course of cell death in human articular chondrocyte cultures treated with FGF2 or IL-1β in the presence or absence of TSA. Cells were cultured and treated as described in Figure 1. Live cells and dead cells were detected as described in Materials and Methods. Cell death is determined as the percentage of dead cells in representative fields (also see Fig. 3). Data represent mean ± SEM from two separate experiments. Control: DMSO vehicle. *, p<0.05, when compared to the group mean at day 1 receiving the same treatment. ✝, p<0.05, when compared to the control group mean at the same time point.
Figure 3
Figure 3
Detection of live cells and dead cell nuclei in human articular chondrocyte cultures treated with FGF2, IL-1β, and TSA. Cells were cultured and treated as described in Figure 1. Green fluorescence indicates live cells and red fluorescence shows nuclei of dead cells.
Figure 4
Figure 4
Effects of FGF2 with or without TSA on gene expression of MMP-13, MMP-1, MMP-3, and ADAMTS5 in human articular chondrocytes. Cells were cultured and treated with FGF2 and TSA for 24 hours as described in Figure 1. mRNA levels were quantified by real time RT-PCR and normalized to GAPDH. Chondrocytes from three patients were examined in separate experiments. Data were combined from these experiments after the group mean of the control without TSA is adjusted to 1. Data are presented as mean ± SEM. + (p<0.05) indicates significant FGF2 effects after comparison of the two group means with and without FGF2 in the absence of TSA; * (p<0.05) indicates significant TSA effects by comparing data with and without TSA at the same level of FGF2.
Figure 5
Figure 5
Effects of IL-1β with or without TSA on gene expression of MMP-13, MMP-1, MMP-3, and ADAMTS5 in human articular chondrocytes. Cells were cultured and treated with IL-1β and TSA for 24 hours as described in Figure 1. mRNA levels were quantified by real time RT-PCR and normalized to GAPDH. Chondrocytes from three patients were examined in separate experiments. Data were combined from these experiments after the group mean of the control without TSA is adjusted to 1. Data are presented as mean ± SEM. + (p<0.05) indicates significant IL-1β effects after comparison of the two group means with and without IL-1β in the absence of TSA; * (p<0.05) indicates significant TSA effects by comparing data with and without TSA at the same level of IL-1β.
Figure 6
Figure 6
Dose response of TSA effects on gene expression of MMP-13, MMP-1, MMP-3 in human articular chondrocytes treated with FGF2. Cells from a single patient were cultured as described in Figure 1 and treated with or without FGF2 (25 ng/ml) in the presence of TSA at various concentrations (0, 50, 100, 200 and 500 nM) for 24 hours. mRNA levels were quantified by real time RT-PCR and normalized to GAPDH. The mean of the group without FGF2 and TSA is adjusted to 1. Data are presented as mean ± SEM. + (p<0.05) indicates significant FGF2 effects after comparison of the two group means with and without FGF2 in the absence of TSA; * (p<0.05) indicates that TSA significantly blocked FGF2 effects by comparing data from FGF2-treated cultures with or without TSA.
Figure 7
Figure 7
Dose response of TSA effects on gene expression of MMP-13, MMP-1, MMP-3 in human articular chondrocytes treated with IL-1β. Cells from a single patient were cultured as described in Figure 1 and treated with/without FGF2 (25ng/ml) in the presence of TSA at various concentrations (0, 50, 100, 200 and 500 nM) for 24 hours. mRNA levels were quantified by real time RT-PCR and normalized to GAPDH. The mean of the group without IL-1β and TSA is adjusted to 1. Data are presented as mean ± SEM. + (p<0.05) indicates significant IL-1β effects after comparison of the two group means with and without IL-1β in the absence of TSA; * (p<0.05) indicates that TSA significantly blocked IL-1β effects comparing data from IL-1β-treated cultures with or without TSA.
Figure 8
Figure 8
Effects of FGF2 and IL-1β with or without TSA on gene expression of COL2A1 and aggrecan in human articular chondrocytes. Cells were cultured and treated with IL-1β and TSA for 24 hours as described in Figure 1. mRNA levels were quantified by real time RT-PCR and normalized to GAPDH. Chondrocytes from three patients were examined in separate experiments. Data were combined from these experiments after the group mean of the control without TSA is adjusted to 100. Data are presented as mean ± SEM. + (p<0.05) indicates significant effects of FGF2 or IL-1β after comparison of the two group means with and without FGF2 or IL-1β in the absence of TSA; * (p<0.05) indicates significant TSA effects by comparing data with and without TSA at the same level of FGF2 or IL-1β.

References

    1. Aigner T, Zien A, Gehrsitz A, Gebhard PM, McKenna L. Anabolic and catabolic gene expression pattern analysis in normal versus osteoarthritic cartilage using complementary DNA-array technology. Arthritis Rheum. 2001;44:2777–2789. - PubMed
    1. Arner EC. Aggrecanase-mediated cartilage degradation. Curr Opin Pharmacol. 2002;2:322–329. - PubMed
    1. Ashburner BP, Westerheide SD, Baldwin AS., Jr. The p65 (RelA) subunit of NF-kappaB interacts with the histone deacetylase (HDAC) corepressors HDAC1 and HDAC2 to negatively regulate gene expression. Mol Cell Biol. 2001;21:7065–7077. - PMC - PubMed
    1. Bau B, Gebhard PM, Haag J, Knorr T, Bartnik E, Aigner T. Relative messenger RNA expression profiling of collagenases and aggrecanases in human articular chondrocytes in vivo and in vitro. Arthritis Rheum. 2002;46:2648–2657. - PubMed
    1. Billinghurst RC, Dahlberg L, Ionescu M, Reiner A, Bourne R, Rorabeck C, Mitchell P, Hambor J, Diekmann O, Tschesche H, Chen J, Van Wart H, Poole AR. Enhanced cleavage of type II collagen by collagenases in osteoarthritic articular cartilage. J Clin Invest. 1997;99:1534–1545. - PMC - PubMed

Publication types

MeSH terms