

Linearity of the fMRI response in category-selective regions of human visual cortex
- PMID: 19107750
- PMCID: PMC6870614
- DOI: 10.1002/hbm.20694
Linearity of the fMRI response in category-selective regions of human visual cortex
Abstract
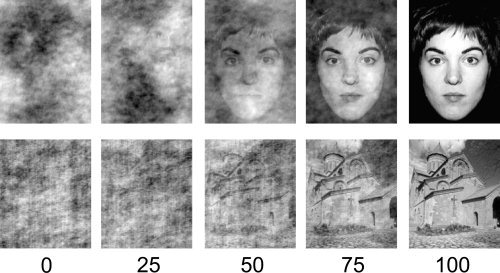
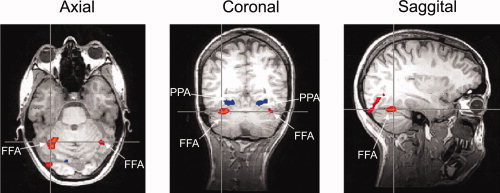
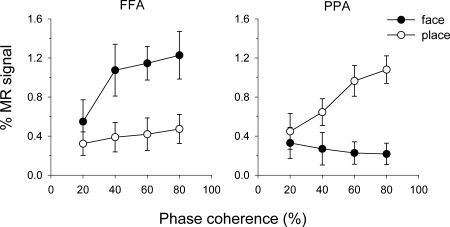
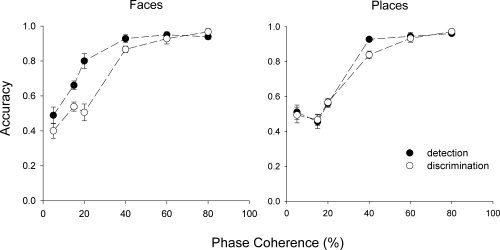
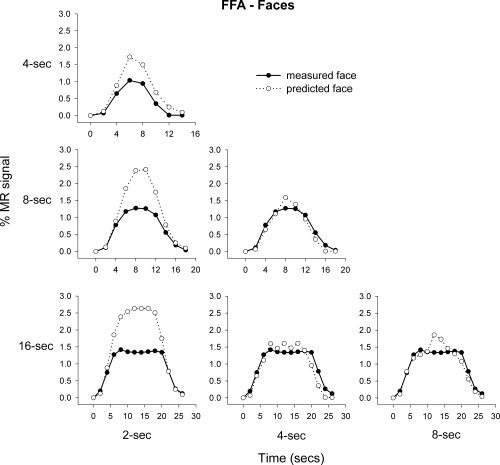
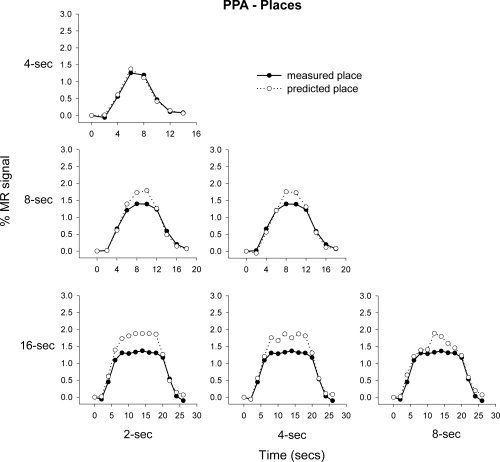
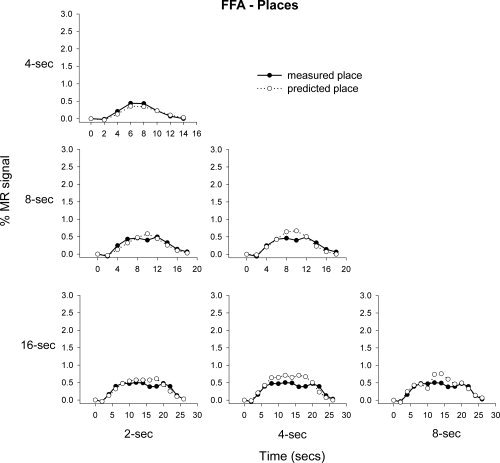
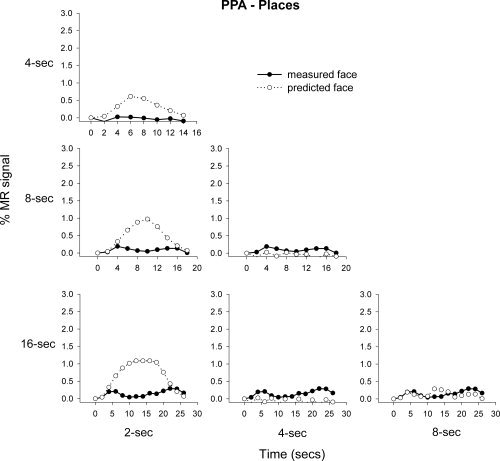
The goal of this study was to determine the linearity of the blood oxygen level-dependent (BOLD) response, as measured by functional magnetic resonance imaging (fMRI), in category-selective regions of human visual cortex. We defined regions of the temporal lobe that were selective to faces (fusiform face area, FFA) and places (parahippocampal place area, PPA). We then determined the linearity of the BOLD response in these regions to their preferred and nonpreferred stimuli. First, we tested the principle of scaling. As we increased the visibility of the stimulus, there was a corresponding linear increase in the fMRI signal in the FFA and PPA to their preferred stimulus (face and place, respectively). In contrast, responses in the FFA and PPA to the nonpreferred stimulus did not conform to the principle of scaling. Next, we asked whether the fMRI response in these regions of visual cortex conformed to the principle of additivity. To assess this, we determined whether the response to a long stimulus block could be predicted by adding the response to multiple shorter duration blocks. Although the fMRI response in the FFA and PPA was generally linear to the preferred stimulus, a more nonlinear response was apparent to the nonpreferred stimulus. In conclusion, the linearity of the BOLD response in the human ventral visual pathway varied across cortical region and stimulus category. This suggests that measures of linearity may provide a useful indication of neural selectivity in the brain.
(c) 2008 Wiley-Liss, Inc.
Figures
References
-
- Andrews TJ ( 2005): Visual cortex: How are objects and faces represented? Curr Biol 15: 451–453. - PubMed
-
- Avidan G,Harel M,Hendler T,Ben‐Bashat D,Zohary E,Malach R ( 2002): Contrast sensitivity in human visual areas and its relationship to object recognition. J Neurophysiol 87: 3102–3116. - PubMed
-
- Birn RM,Saad ZS,Bandettini PA ( 2001): Spatial heterogeneity of the nonlinear dynamics in the FMRI BOLD response. Neuroimage 14: 817–826. - PubMed
-
- Bohning DE,Shastri A,Lomarev MP,Lorberbaum JP,Nahas Z,George MS ( 2003): BOLD‐fMRI response vs. transcranial magnetic stimulation (tms) pulse‐train length: Testing for linearity. J Magn Reson Imaging 17: 279–290. - PubMed
MeSH terms
LinkOut - more resources
Full Text Sources
Research Materials
