Comparative Study
. 2009 Jan 1;182(1):171-82.
doi: 10.4049/jimmunol.182.1.171.

CCR5 expression levels influence NFAT translocation, IL-2 production, and subsequent signaling events during T lymphocyte activation

Affiliations
Comparative Study

CCR5 expression levels influence NFAT translocation, IL-2 production, and subsequent signaling events during T lymphocyte activation

Jose F Camargo et al. J Immunol. .

Abstract

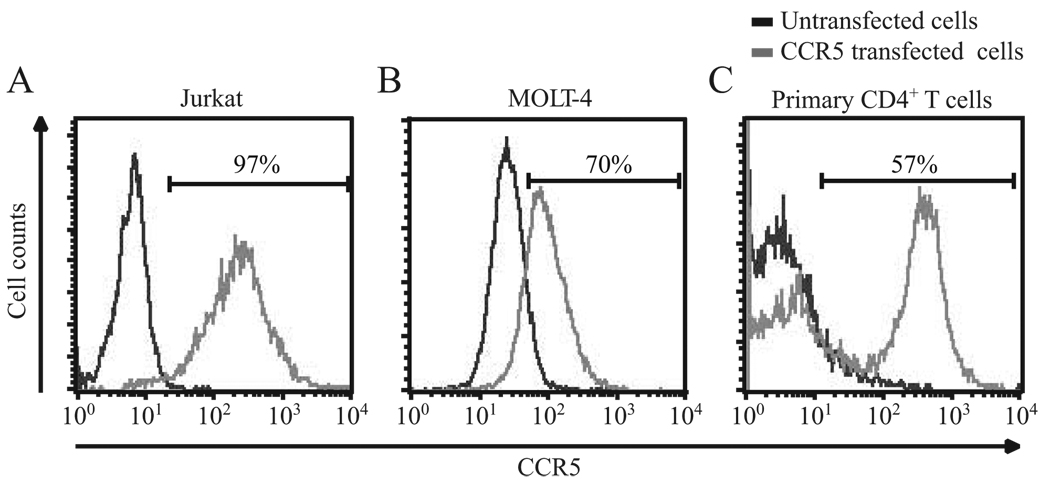
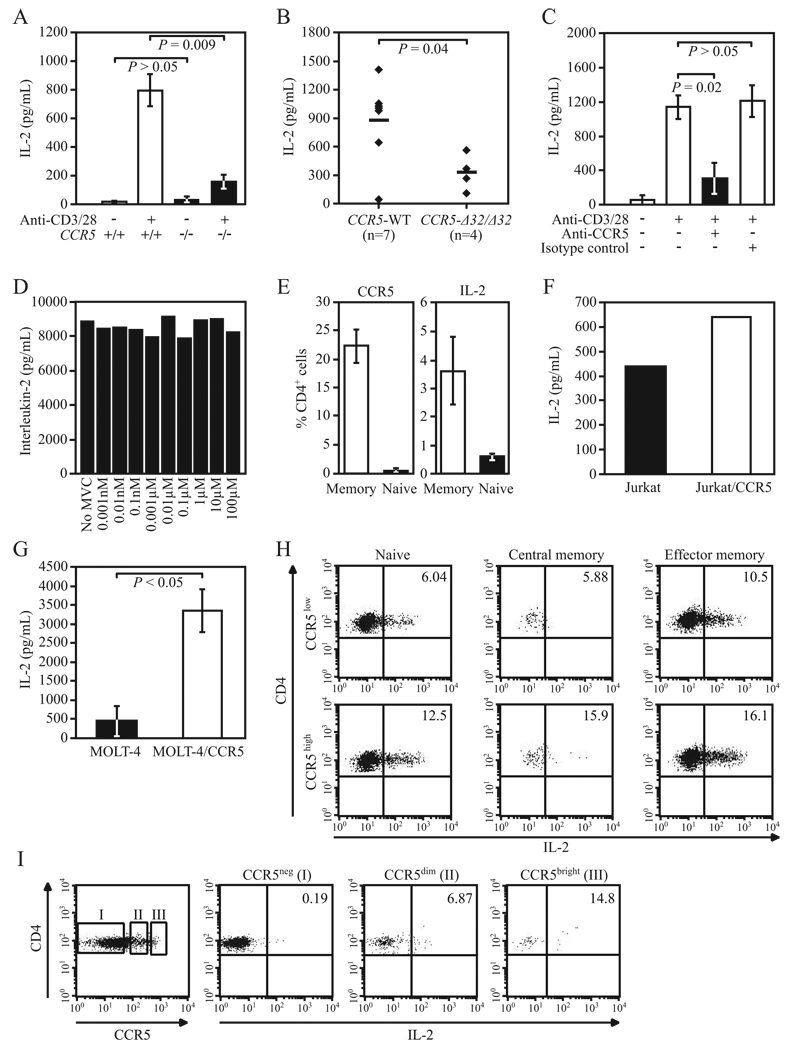
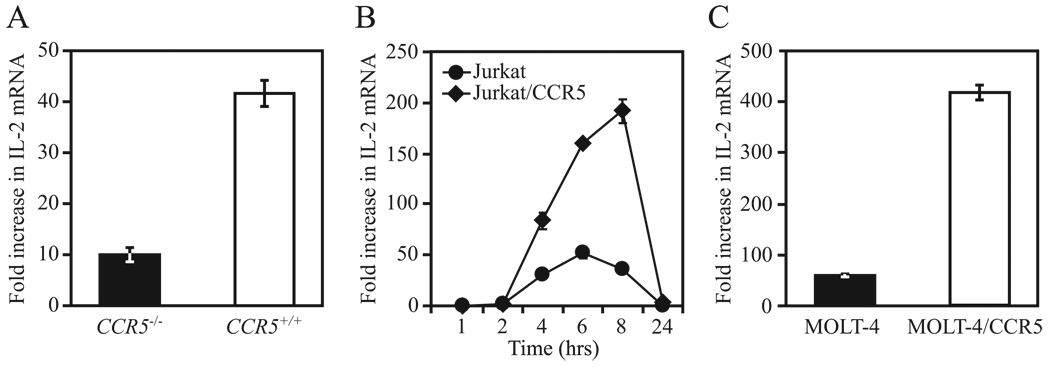
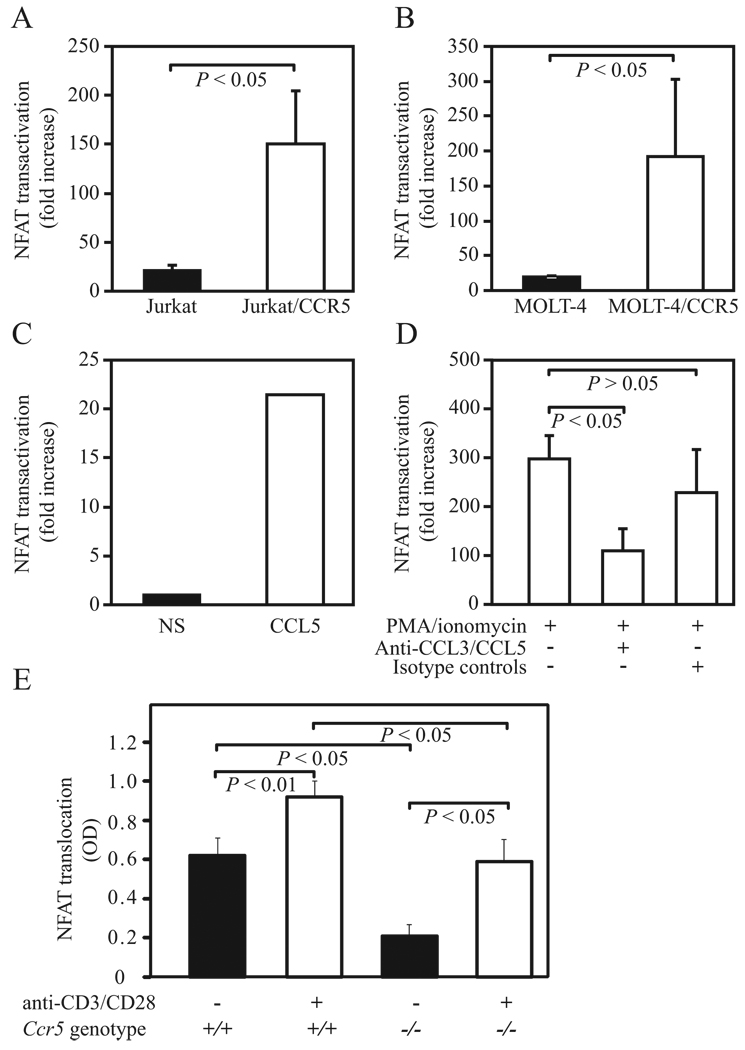
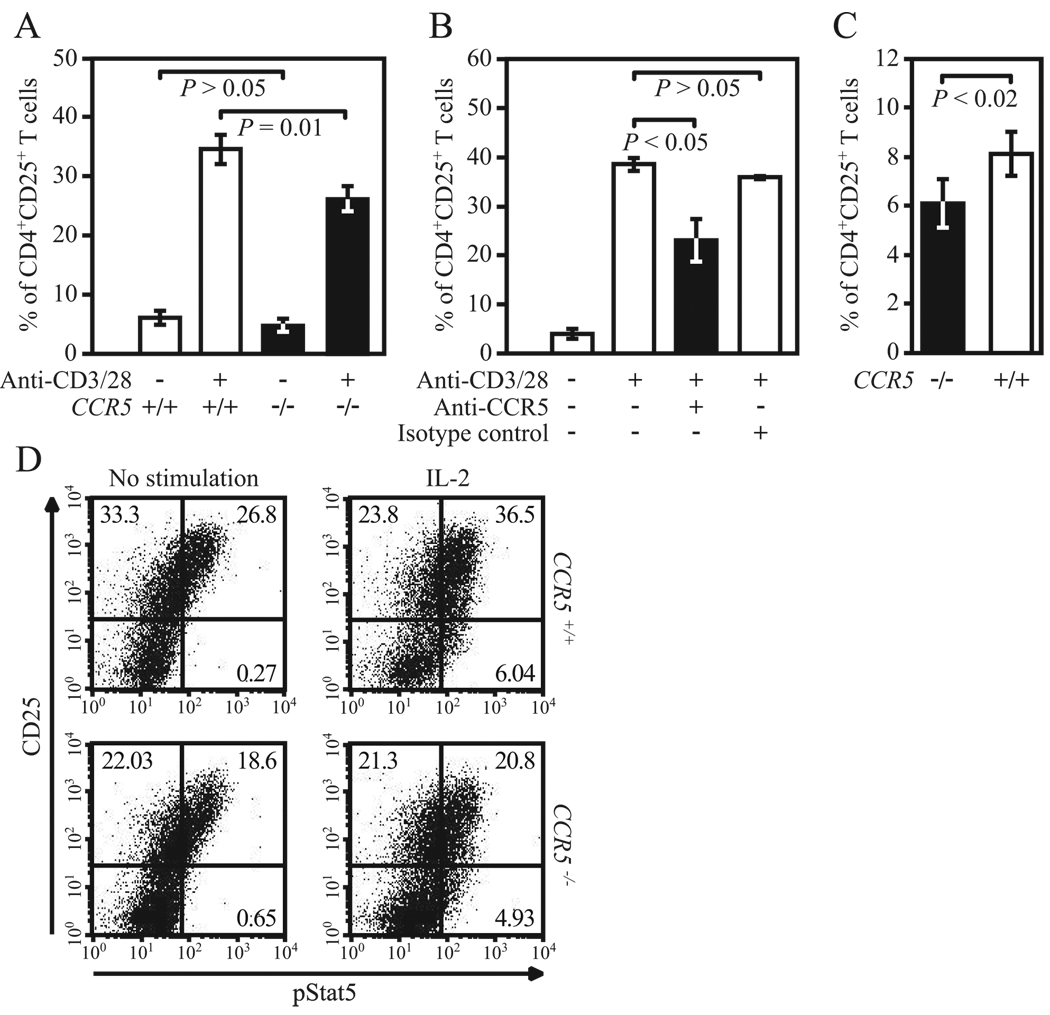
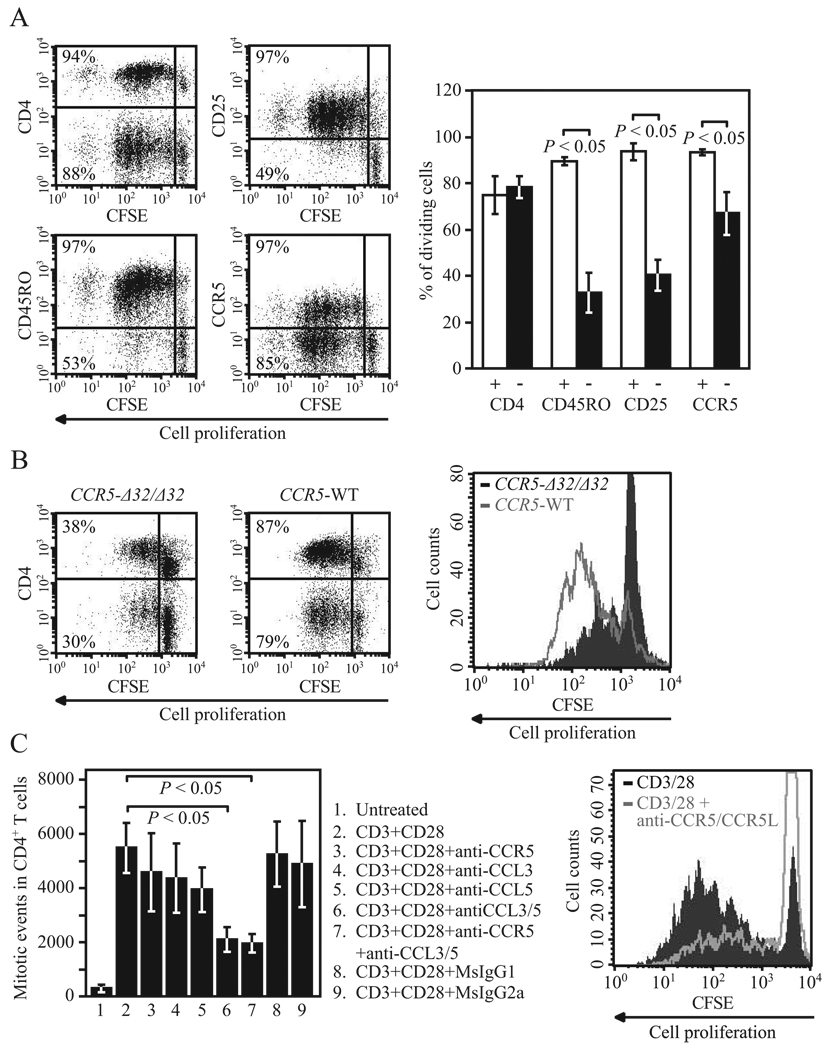
Ligands of CCR5, the major coreceptor of HIV-1, costimulate T lymphocyte activation. However, the full impact of CCR5 expression on T cell responses remains unknown. Here, we show that compared with CCR5(+/+), T cells from CCR5(-/-) mice secrete lower amounts of IL-2, and a similar phenotype is observed in humans who lack CCR5 expression (CCR5-Delta32/Delta32 homozygotes) as well as after Ab-mediated blockade of CCR5 in human T cells genetically intact for CCR5 expression. Conversely, overexpression of CCR5 in human T cells results in enhanced IL-2 production. CCR5 surface levels correlate positively with IL-2 protein and mRNA abundance, suggesting that CCR5 affects IL-2 gene regulation. Signaling via CCR5 resulted in NFAT transactivation in T cells that was blocked by Abs against CCR5 agonists, suggesting a link between CCR5 and downstream pathways that influence IL-2 expression. Furthermore, murine T cells lacking CCR5 had reduced levels of intranuclear NFAT following activation. Accordingly, CCR5 expression also promoted IL-2-dependent events, including CD25 expression, STAT5 phosphorylation, and T cell proliferation. We therefore suggest that by influencing a NFAT-mediated pathway that regulates IL-2 production and IL-2-dependent events, CCR5 may play a critical role in T cell responses. In accord with our prior inferences from genetic-epidemiologic studies, such CCR5-dependent responses might constitute a viral entry-independent mechanism by which CCR5 may influence HIV-AIDS pathogenesis.


Conflict of interest statement

Disclosures

The authors have no financial conflicts of interest.

Figures

FIGURE 1
FIGURE 1
CCR5 surface expression in human T cells. Plots showing the CCR5 surface expression in (A) Jurkat, (B) MOLT-4, and (C) primary human CD4+ T cells before and after engineering cells to overexpress CCR5. In untransfected cells (black lines), dim levels of CCR5 were detected in less than 1%, 3%, and 5% of Jurkat, MOLT-4, and primary CD4+ T cells, respectively. In contrast, very high surface levels of CCR5 were detected in 97%, 70%, and 57% of the cells engineered to overexpress CCR5 (gray lines) in Jurkat CCR5, MOLT-4, and primary CD4+ T cells, respectively. These cells were designated herein as Jurkat/CCR5, MOLT-4/CCR5 and CCR5high cells, respectively. CCR5 mean fluorescence intensity values were also significantly different between untransfected vs CCR5 transfected cells in Jurkat, MOLT-4, and primary human CD4+ T cells, and in these cell types the values were 43 vs 209, 74 vs 112, and 35 vs 271, respectively.
FIGURE 2
FIGURE 2
CCR5 expression levels influence IL-2 levels in T cells. A–C, IL-2 levels were measured by ELISA in culture supernatants obtained after 48 h of cell stimulation with anti-CD3 and anti-CD28 Abs; the sources of the cells were (A) purified T cells from C57BL/6J CCR5−/− and CCR5+/+ mice (data from three independent experiments), (B) PBMC from CCR5 WT (i.e., those lacking the CCR532 allele) and CCR53232 healthy individuals (n = no. of individuals/group), and (C) PBMC from three CCR5 WT healthy donors preincubated with anti-CCR5 or nonspecific isotype control Abs. Data in A and C are means ± SEM, and in B, horizontal lines reflect mean values. D, Purified human T cells were treated with different concentrations of maraviroc (0.001 nM to 100 µM; Selzentry; Pfizer) for 1 h at 37°C followed by stimulation with plate-bound anti-CD3 Ab (1 µg/ml; BD Pharmingen) and soluble anti-CD28 Ab (0.5 µg/ml; BD Pharmingen). IL-2 levels were measured by ELISA in culture supernatants after 48 h of stimulation. Results are representative of four experiments. E, Surface levels of CCR5 and intracellular levels of IL-2 were measured at the single cell level by FACS in PBMC from five healthy donors. Histograms correspond to percentage (mean ± SEM) of memory (CD45RO+) and naive (CD45RO) CD4+ cells expressing CCR5 (left) and IL-2 (right). F, Representative data of IL-2 levels measured by ELISA in culture supernatants of CCR5 overexpressing Jurkat T cells (Jurkat/CCR5) and native Jurkat T cells after 24 h of stimulation with PMA/ionomycin. Data are representative of two independent experiments. G, Experimental approach as in E, but using native MOLT-4 and MOLT-4/CCR5 T cells. Data (mean ± SEM) are from three independent experiments. H, FACS plots showing CD3/CD28-induced IL-2 production (see x-axis; numbers in upper right box indicate percentage of IL-2-producing cells in naive (CD45ROCCR7+), central memory (CD45RO+CCR7+), and effector memory (CD45RO+CCR7) primary human CD4+ T cells before (top panels; CCR5low: CCR5 surface expression <5%) and after overexpression of CCR5 using a lentiviral system (bottom panels; CCR5high: CCR5 surface expression ~60%). I, IL-2 expression correlates with CCR5 expression. Leftmost panel shows the extent of intracellular expression of CCR5 in primary human CD4+ cells. I, II, and III indicate, respectively, CCR5-negative (CCR5neg), CCR5-positive dim (CCR5dim), and CCR5-positive bright (CCR5bright) CD4+ cells. The next three panels show the extent of intracellular expression of IL-2 in these three groups of CD4+ cells. Results are representative of three independent experiments.
FIGURE 3
FIGURE 3
CCR5 surface expression levels influence IL-2 transcript levels. A, IL-2 mRNA levels (mean ± SEM) were determined by quantitative RT-PCR in purified T cells from C57BL/6J CCR5−/− and CCR5+/+ mice after 4 h of stimulation with anti-CD3/28 Abs. Data are representative of three independent experiments. B, IL-2 mRNA levels determined by quantitative RT-PCR in Jurkat T cells overexpressing CCR5 (Jurkat/CCR5) and native Jurkat at the indicated time points after stimulation with PMA/ionomycin. Results are representative of three independent experiments. C, Experimental protocol is as in B except using MOLT-4 and MOLT-4/CCR5 cells. IL-2 mRNA levels (mean ± SEM) were assessed after 6 h of stimulation. Results are representative of three independent experiments.
FIGURE 4
FIGURE 4
CCR5 surface expression influences NFAT transactivation and levels. A and B, NFAT transactivation (represented as mean fold increase ± SEM) was measured by luciferase reporter assays in (A) native and Jurkat/CCR5 T cells and (B) native MOLT-4 and MOLT-4/CCR5 T cells 24 h after stimulation with PMA/ionomycin. Data are representative of three independent experiments. C, NFAT transactivation was measured by luciferase reporter assay in purified T cells from C57BL/6J WT mice after 4 h of stimulation with CCL5. NS, nonstimulated cells. Data are representative of three independent experiments. D, NFAT transactivation in MOLT-4/CCR5 cells stimulated as described in B in the presence or absence of neutralizing Abs against CCL3/CCL3L1 and CCL5 or nonspecific isotype controls (10 µg/ml). Data are from three independent experiments. E, Levels of NFAT2 in the nuclear extracts obtained from unstimulated and TCR-stimulated T cells from WT (Ccr5+/+) and Ccr5−/− mice. Each bar represents the mean (±SD) OD measured from three independent samples. ANOVA with Bonferroni correction was used to determine statistical significance between the groups. Differences were considered statistically significant at p ≤ 0.05.
FIGURE 5
FIGURE 5
CCR5 level influences expression of CD25. A and B, CD25 expression in CD4+ T cells was measured by FACS after 48 h of stimulation with anti-CD3/28 Abs in (A) purified T cells from C57BL/6J CCR5−/− and CCR5+/+ mice (data from three independent experiments) and (B) purified T cells from WT healthy donors (n = 3) preincubated with anti-CCR5 or nonspecific isotype control Abs. C, CD25 expression in CD4+ T cells was measured by FACS in PP from C57BL/6J CCR5−/− and CCR5+/+ mice (data from three independent experiments). D, Plots show relationship between CCR5 and STAT5 phosphorylation assessed by FACS 15 min after stimulation with rIL-2 (100 ng/ml) in primary T blasts (i.e., after 48 h of stimulation with anti-CD3/CD28 Abs followed by 24 h of serum starvation) from C57BL/6J CCR5−/− and CCR5+/+ mice. Numbers in quadrants correspond to percentage of cells. Data are representative of three independent experiments.
FIGURE 6
FIGURE 6
CCR5 surface expression levels influence T cell proliferation. A, T cell proliferation was determined by CFSE dilution assay in PBMC from healthy donors after 5 days in culture. The experimental protocol used to induce CCR5 expression was as described previously (35) and included 72 h of stimulation with anti-CD3/CD28 Abs followed by 48 h of cell culture without Abs. Plots on the left show representative data of CFSE dilution assay in different cell populations defined by expression of CD4, CD25, CD45RO, and CCR5. Numbers in the quadrants correspond to the proportion of dividing cells within each specific cell population. In the panel on the right, histograms (mean ± SEM) correspond to percentage of dividing cells from five healthy individuals. Symbols in the bottom represent the presence (+) or absence (−) of the indicated surface marker. B, CFSE dilution assay after 96 h of stimulation in PBMC from an individual homozygous for the CCR532 mutation (left) and an age- and race-matched WT control (middle). Numbers in the quadrants correspond to percentage of dividing cells within CD4+ and CD4 cell populations. Panel on the right shows overlay of the plots depicting cell proliferation in CD4+ cells from these two donors. C, T cell proliferation was determined by CFSE dilution assay in purified T cells from healthy donors (n = 3) after 6 days of stimulation with anti-CD3/CD28 Abs in the presence or absence of neutralizing Abs against the CCR5 ligands CCL3/CCL3L1 and CCL5 or nonspecific isotype controls. In some experiments, cells were preincubated with anti-CCR5 or nonspecific isotype control Abs. Histograms (mean ± SEM) correspond to number of mitotic events calculated as described previously (90). Numbers at the bottom correspond to the experimental conditions depicted on the side. On the right, the overlay of CFSE plots from experimental condition nos. 2 (CD3/CD28 stimulation only) and 7 (CD3/CD28 stimulation following blockade of CCR5 and the CCR5 ligands) are shown; CCR5L represents CCL3/CCL3L1 and CCL5.

References

    1. Bromley SK, Burack WR, Johnson KG, Somersalo K, Sims TN, Sumen C, Davis MM, Shaw AS, Allen PM, Dustin ML. The immunological synapse. Annu. Rev. Immunol. 2001;19:375–396. - PubMed
    1. Friedman RS, Jacobelli J, Krummel MF. Surface-bound chemokines capture and prime T cells for synapse formation. Nat. Immunol. 2006;7:1101–1108. - PubMed
    1. Castellino F, Huang AY, Altan-Bonnet G, Stoll S, Scheinecker C, Germain RN. Chemokines enhance immunity by guiding naive CD8+ T cells to sites of CD4+ T cell-dendritic cell interaction. Nature. 2006;440:890–895. - PubMed
    1. Taub DD, Conlon K, Lloyd AR, Oppenheim JJ, Kelvin DJ. Preferential migration of activated CD4+ and CD8+ T cells in response to MIP-1 alpha and MIP-1 beta. Science. 1993;260:355–358. - PubMed
    1. Moser B, Loetscher P. Lymphocyte traffic control by chemokines. Nat. Immunol. 2001;2:123–128. - PubMed

Publication types

MeSH terms