. 2009 Jan 1;182(1):259-73.
doi: 10.4049/jimmunol.182.1.259.

Epigenetic regulation of Foxp3 expression in regulatory T cells by DNA methylation

Affiliations

Epigenetic regulation of Foxp3 expression in regulatory T cells by DNA methylation

Girdhari Lal et al. J Immunol. .

Abstract

Foxp3, a winged-helix family transcription factor, serves as the master switch for CD4(+) regulatory T cells (Treg). We identified a unique and evolutionarily conserved CpG-rich island of the Foxp3 nonintronic upstream enhancer and discovered that a specific site within it was unmethylated in natural Treg (nTreg) but heavily methylated in naive CD4(+) T cells, activated CD4(+) T cells, and peripheral TGFbeta-induced Treg in which it was bound by DNMT1, DNMT3b, MeCP2, and MBD2. Demethylation of this CpG site using the DNA methyltransferase inhibitor 5-aza-2'-deoxycytidine (Aza) induced acetylation of histone 3, interaction with TIEG1 and Sp1, and resulted in strong and stable induction of Foxp3. Conversely, IL-6 resulted in methylation of this site and repression of Foxp3 expression. Aza plus TGFbeta-induced Treg resembled nTreg, expressing similar receptors, cytokines, and stable suppressive activity. Strong Foxp3 expression and suppressor activity could be induced in a variety of T cells, including human CD4(+)CD25(-) T cells. Epigenetic regulation of Foxp3 can be predictably controlled with DNMT inhibitors to generate functional, stable, and specific Treg.


Figures
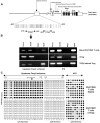
FIGURE 1
FIGURE 1
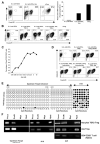
Methylation of upstream Foxp3 CpG island. A, Schematic view of mouse Foxp3 gene and upstream CpG island analyzed with GrailExp software (compbio.ornl.gov). Filled bars represent the individual CpG residues. “Kim and Leonard, 2007” is Ref. 7 and “Tone et al., 2008” is Ref. 19. B, CD4+CD25gfp T cells (naive) and CD4+CD25+gfp+ T cells (nTreg) were purified. CD4+CD25gfp T cells were cultured with irradiated, syngeneic, T cell-depleted splenocytes in the presence of IL-2, anti-CD3ε mAb, and TGFβ for 4 days, and CD4+CD25+gfp+ T cells were purified by FACS sorting. Genomic DNA was isolated, digested with MspI (methyl insensitive), HpaII (methyl sensitive), or EcoRI (negative control), PCR amplified using upstream Foxp3 enhancer- or H19-specific primers, and PCR products were resolved on agarose gels. Data are representative of three experiments. C, Genomic DNA was isolated from the indicated T cell subsets, modified with sodium bisulfite, PCR amplified, cloned into the pGEM-T vector, and individual clones were sequenced. The methylation pattern of each clone obtained is shown. ●, Methylated CpG; ○, nonmethylated CpG.
FIGURE 2
FIGURE 2
DNMT inhibitors induce Foxp3 expression in CD4+CD25T cells. A, CD4+CD25 T cells from BALB/c male mice were cultured with irradiated, syngeneic, T cell-depleted splenocytes in the presence of IL-2 (10 ng/ml), anti-CD3ε mAb (1 μg/ml), or Aza (10 μM) for 4 days. nTreg were cultured without Aza. Intracellular Foxp3 was analyzed by gating on CD4+ cells (left). Foxp3 mRNA expression in the same cultured cells was analyzed by qRT-PCR (right). B, CD4+CD25 T cells from BALB/c male mice were cultured for 4 days in the presence of IL-2, anti-CD3ε, TGFβ, and Aza (10 μM). Intracellular Foxp3 was analyzed by gating on CD4+ cells. C, Dose response to Aza for Foxp3 expression in CD4+CD25 T cells in the presence of IL-2, anti-CD3ε mAb, and TGFβ. D, Foxp3 expression in CD4+CD25 cells cultured in the indicated conditions along with the DNMT inhibitors RG108 (5 μM), hydralazine (5 μM), procainamide (5 μM) or Aza (5 μM). Inhibitors were removed after 24 h and cells were recultured for another 3 days. Foxp3 expression was analyzed by gating on CD4+ cells. E, CD4+CD25 Foxp3gfp T cells were purified from Foxp3gfp reporter male mouse spleens using flow cytometry. CD4+CD25Foxp3gfp (50,000 cells/well) were cultured with irradiated T cell-depleted syngenic splenocytes (50,000 cells/well) along with IL-2, anti-CD3ε, TGFβ, and Aza for up to 4 days. Aza was removed after 24 h. CD4+CD25+Foxp3gfp+ T cells were purified by flow cytometry after culture. Methylation of upstream Foxp3 enhancer CpG island and H19 in TGFβ plus Aza-induced CD4+CD25+Foxp3+gfp+ Treg was analyzed by disulfite sequencing. F, Methyl-specific restriction digestion of genomic DNA and PCR analysis of upstream Foxp3 enhancer, H19, and the first intronic region of AID in Aza- and Aza plus TGFβ-induced CD4+CD25+Foxp3+gfp+ Treg. Data are representative of 2–4 independent experiments for each panel.
FIGURE 3
FIGURE 3
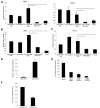
Foxp3 enhancer is occupied by DNMTs. CD4+CD25Foxp3gfp (naive) or CD4+CD25+Foxp3gfp+ (nTreg) cells were purified from Foxp3gfp reporter male mice by flow cytometry. CD4+CD25Foxp3gfp T cells (50,000 cells/well) were cultured with irradiated, syngenic, T cell-depleted splenocytes (50,000 cells/well) along with anti-CD3ε mAb (1 μg/ml), IL-2 (10 ng/ml), TGFβ (5 ng/ml), and Aza (1 μM) for 4 days. Aza was removed after 24 h. After culture, CD4+CD25+Foxp3gfp+ T cells were purified using flow cytometry. A, ChIP assay on upstream Foxp3 enhancer using the indicated cells with anti-DNMT1 (left) and anti-DNMT3b (right). B, ChIP assay on upstream enhancer with anti-MBD2. C, ChIP assay on upstream enhancer with anti-MeCP2. D, BW5147.3 lymphoma T cells transfected with control vector (pGL3) or Foxp3 enhancer containing plasmid (pGL3-CpG). Luciferase activity was monitored 48 h after transfection. E, pGL3-CpG construct (3 μg) was cotransfected along with control plasmid, pGFP-DNMT1, pGFP-DNMT3a, or pGFP-DNMT3b1 (12 μg). Luciferase activity was monitored 48 h after transfection. F, Inhibition of enhancer activity by in vitro methylation of the upstream Foxp3 CpG enhancer site. Data were normalized to luciferase activity of control sample. Data shown are representative of 2-3 independent experiments for each panel. *, p <0.05.
FIGURE 4
FIGURE 4
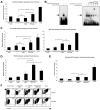
Foxp3 upstream enhancer of Aza plus TGFβ Treg is transcriptionally active. CD4+CD25Foxp3gfp (naive) or CD4+CD25+Foxp3gfp+ (nTreg) cells were purified from Foxp3gfp reporter male mice by flow cytometry. CD4+CD25Foxp3gfp T cells (50,000 cells/well) were cultured with irradiated, syngenic, T cell-depleted splenocytes (50,000 cells/well) along with anti-CD3ε mAb (1 μg/ml), IL-2 (10 ng/ml), TGFβ (5 ng/ml), and Aza (1 μM) for 4 days. Aza was removed after 24 h. After culture, CD4+CD25+Foxp3gfp+ T cells were purified again using flow cytometry. A, ChIP assay for upstream Foxp3 enhancer using the indicated cells and anti-mouse Sp1. B, EMSA with Foxp3 enhancer CpG oligonucleotide (20 fmol), Aza plus TGFβ-induced Treg nuclear extract (10 μg), and 200-fold excess unlabeled Foxp3 enhancer CpG oligonucleotide. Competition EMSA with Foxp3 enhancer CpG oligonucleotide, Aza plus TGFβ-induced Treg nuclear extract, and graded amounts of unlabeled Sp1 consensus oligonucleotide. C, TGFβ or Aza plus TGFβ-induced CD4+CD25+Foxp3gfp+ Treg were generated by culturing CD4+CD25Foxp3gfp T cells as described in A. ChIP assay was conducted for AcH3 binding to the upstream Foxp3 enhancer (left) and the proximal promoter (right). D, ChIP assay for TIEG1 at upstream Foxp3 enhancer was performed from the cultured cells described above. E, ChIP assay for pSmad2/3 at Foxp3 proximal promoter was performed from the cultured cells described above. F, CD4+CD25 T cells were purified from Smad3−/− or wild-type male mice spleen using flow cytometry. Foxp3 expression in Smad3−/− and wild-type T cells after 4 days of culture (Aza at 1 μM for 24 h). Intracellular Foxp3 expression was analyzed by gating on CD4+ cells. Data are representative of 2-3 independent experiments. *, p <0.05; n.s., not significant.
FIGURE 5
FIGURE 5
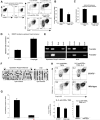
IL-6 down-regulates Foxp3 expression in nTreg. A, CD4+CD25+ T cells were purified from the BALB/c male mouse spleens by flow cytometry. Freshly isolated CD4+CD25+ T cells (5 × 10⁴ cells/well) from BALB/c mice were cultured with IL-2, anti-CD3ε mAb, and TGFβ with or without IL-6 (20 ng/ml) and APC for 4 days. Intracellular Foxp3 expression was monitored by gating on CD4+ cells. B, Foxp3 mRNA expression from the above cultures was analyzed by qRT-PCR. C, CD4+ T cells from the above cultures were subjected to ChIP assay for AcH3 at the upstream Foxp3 enhancer. D, Freshly purified CD4+Foxp3gfp+ T cells (5 × 10⁴ cells/well) from Foxp3gfp male mice were cultured with IL-2, anti-CD3ε mAb, TGFβ, IL-6, and APC for 6 days and separate Foxp3gfp+ and Foxp3gfp CD4 T cells were then purified using flow cytometry. DNMT1 binding on the upstream Foxp3 enhancer was analyzed by ChIP assay. E, Methyl-specific restriction digestion of genomic DNA of upstream Foxp3 enhancer and H19 promoters. F, Disulfite sequencing of the upstream Foxp3 enhancer and H19 in TGFβ plus IL-6 induced Foxp3gfp nTreg. The methylation pattern of each clone obtained is shown. ●, Methylated CpG; ○, nonmethylated CpG. G, qRT-PCR analysis of Foxp3 mRNA. H, CD4+CD25+ T cells (5 × 10⁴ cells/well) were purified from the STAT3−/− (CD4 Cre:STAT3 f/f) or littermate control male mice and cultured with IL-2, anti-CD3ε mAb, TGFβ, IL-6, and APC for 4 days. Intracellular Foxp3 expression was analyzed by gating on CD4+ cells (top). Foxp3 mRNA expression was analyzed by qRT-PCR from the same cells (bottom). Data are representative two independent experiments for entire figure.
FIGURE 6
FIGURE 6
Induction of Foxp3 in T cell subsets. A, CD4+CD25 T cells were purified from BALB/c male spleens using flow cytometry. CD4+CD25 T cells were cultured with APC, IL-2, anti-CD3ε mAb, Aza (1.25 μM), and TGFβ (5 ng/ml). Aza was removed from the culture at the indicated time points and the cells were recultured for up to a total of 4 days. Intracellular Foxp3 expression was analyzed by gating on CD4+ cells. B, CFSE labeled-CD4+CD25 T cells cultured in the indicated conditions for 4 days (Aza at 1.25 μM for 24 h) and intracellular Foxp3 and CFSE dilution analyzed by gating on CD4+ cells. C, CD4+CD25Foxp3gfp T cells (naive) and CD4+CD25+Foxp3gfp+ T cells (nTreg) were purified from the Foxp3gfp reporter male spleens using flow cytometry. TGFβ or Aza plus TGFβ-induced CD4+CD25+Foxp3gfp+ Tregs were generated by a 4-day culture of CD4+CD25Foxp3gfp T cells. CD4+CD25+Foxp3gfp+ Tregs were purified from the indicated cultures and then recultured in the presence of IL-2, anti-CD3ε mAb, and APC for an additional 4 days. Stability of Foxp3gfp expression was analyzed by gating on CD4+ cells. D, CD4+CD25CD62LhighCD44low (naive) and CD4+CD25CD62LlowCD44high (memory) cells were isolated from BALB/c male spleens by flow cytometric sorting and cultured. Foxp3 expression was analyzed by gating on CD4+ cells. E, CD4+CD25 T cells were purified from BALB/c male spleens using flow cytometry. CD4+CD25 T cells were cultured with APC, anti-CD3ε mAb, IL-2, Aza (1 μM for 24 h), and the indicated mAb and cytokines for 5 days. Th1 conditions were IL-12 (5 ng/ml), IFN-γ (20 ng/ml), and anti-IL-4 mAb (10 μg/ml), Th2 conditions were IL-4 (10 ng/ml) and anti-IFN-γ (10 μg/ml), and Th17 conditions were IL-6 (10 ng/ml) and TGFβ (5 ng/ml). Foxp3 expression was analyzed by gating on CD4+ cells. F, Cytokine mRNA expression from cells cultured with anti-CD3ε mAb, IL-2, APC, and the indicated Th culture conditions with or without Aza (1 μM for 24 h). Data are representative of 2–4 independent experiments.
FIGURE 7
FIGURE 7
Aza plus TGFβ Treg are suppressive. A, Freshly isolated CD4+CD25 T cells from BALB/c male were sorted and labeled with CFSE and 5 × 10⁴ cells per well were cultured with the indicated Treg subsets (5 × 10⁴ cells/well) in the presence of APC and anti-CD3ε mAb (1 μg/ml) for 72 h. Proliferation of T cells was measured by CFSE dilution. Percentages of divided and undivided cells are shown. B, Aza plus TGFβ Treg prevent auto-immune colitis. C, B-17 SCID mice were injected i.p. with CD4+CD25 CD45RBhigh T cells (5 × 10⁵) purified from BALB/c mice either alone or together with purified, cultured CD4+ CD25+Foxp3gfp+ Treg subsets as indicated (2.5 × 10⁵ cells/mouse). Weights were measured at the indicated times; n = 4-5 mice/group. C, Histopathology of the colon and spleen sizes 67 days after T cell reconstitution. Original magnification was ×100. Scale bar, 1 cm. D, Streptozotocin-induced diabetic BALB/c mice received C57BL/6 mice islets (400 islets/mouse) underneath the right kidney capsule along with purified cultured CD4+CD25+ Foxp3gfp+ Treg (1 × 10⁶ cells/mouse) injected i.v. Blood glucose levels were monitored daily; n = 6 mice/group (p <0.001 for all subsets of Treg vs no Treg or naive CD4+ T cell group; p > 0.05 for Aza plus TGFβ Treg vs TGFβ Treg or nTreg). Data are representative of 2-5 independent experiments.
FIGURE 8
FIGURE 8
Aza plus TGFβ induce Foxp3 expression and suppressive function in human CD4+CD25 T cells. A, CD4+CD25 T cells (5 × 10⁴ cells/well) purified from PBMC were cultured with syngeneic CD4+ T cell-depleted PBMC (5 × 10⁴ cells/well) with anti-CD3ε mAb, IL-2 (10 ng/ml), TGFβ (5 ng/ml) or Aza (1 μM) for 6 days. Aza was removed after 24 h. Intracellular Foxp3 expression was monitored by flow cytometry. Data are representative of three independent experiments with different blood donors. B, Foxp3 mRNA expression from cells in A. C, Freshly purified, CFSE-labeled CD4+CD25 T cells were cultured with different ratios of purified cultured CD4+CD25+ Treg subsets along with irradiated T cell-depleted autologous PBMCs and anti-human CD3ε mAb for 96 h. Data are representative of three independent experiments.

References

    1. Sakaguchi S, Powrie F. Emerging challenges in regulatory T cell function and biology. Science. 2007;317:627–629. - PubMed
    1. van Maurik A, Herber M, Wood KJ, Jones ND. Cutting edge: CD4+CD25+ alloantigen-specific immunoregulatory cells that can prevent CD8+ T cell-mediated graft rejection: implications for anti-CD154 immunotherapy. J. Immunol. 2002;169:5401–5404. - PubMed
    1. Wang HY, Wang RF. Regulatory T cells and cancer. Curr. Opin. Immunol. 2007;19:217–223. - PubMed
    1. Marie JC, Letterio JJ, Gavin M, Rudensky AY. TGF-β1 maintains suppressor function and Foxp3 expression in CD4+CD25+ regulatory T cells. J. Exp. Med. 2005;201:1061–1067. - PMC - PubMed
    1. Fontenot JD, Rasmussen JP, Williams LM, Dooley JL, Farr AG, Rudensky AY. Regulatory T cell lineage specification by the forkhead transcription factor foxp3. Immunity. 2005;22:329–341. - PubMed

Publication types

MeSH terms