. 2009 Jan 1;182(1):329-39.
doi: 10.4049/jimmunol.182.1.329.

Btk regulates B cell receptor-mediated antigen processing and presentation by controlling actin cytoskeleton dynamics in B cells

Affiliations

Btk regulates B cell receptor-mediated antigen processing and presentation by controlling actin cytoskeleton dynamics in B cells

Shruti Sharma et al. J Immunol. .

Abstract

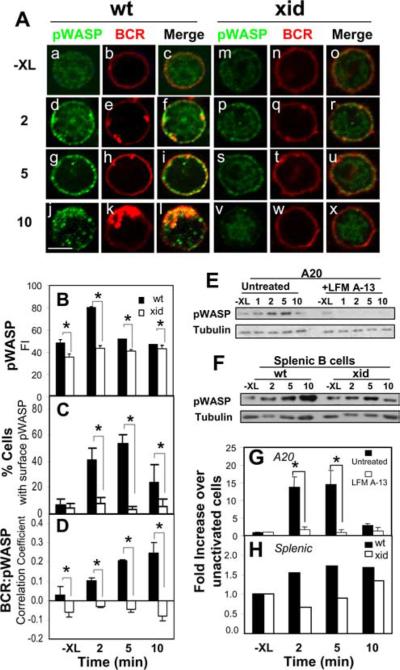
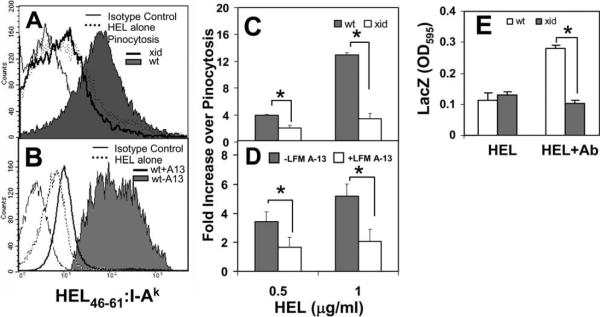
The high efficiency of Ag processing and presentation by B cells requires Ag-induced BCR signaling and actin cytoskeleton reorganization, although the underlying mechanism for such requirements remains elusive. In this study, we identify Bruton's tyrosine kinase (Btk) as a linker connecting BCR signaling to actin dynamics and the Ag transport pathway. Using xid mice and a Btk inhibitor, we show that BCR engagement increases actin polymerization and Wiskott-Aldrich syndrome protein activation in a Btk-dependent manner. Concurrently, we observe Btk-dependent increases in the levels of phosphatidylinositide-4,5-bisphosphate and phosphorylated Vav upon BCR engagement. The rate of BCR internalization, its movement to late endosomes, and efficiency of BCR-mediated Ag processing and presentation are significantly reduced in both xid and Btk inhibitor-treated B cells. Thus, Btk regulates actin dynamics and Ag transport by activating Wiskott-Aldrich syndrome protein via Vav and phosphatidylinositides. This represents a novel mechanism by which BCR-mediated signaling regulates BCR-mediated Ag processing and presentation.


Figures

FIGURE 1
FIGURE 1
BCR activation induces the reorganization of the actin cytoskeleton and this actin remodeling is dependent on Btk. A, Wt splenic and A20 B cells that were treated or left untreated with Btk inhibitor LFM-A13 (100 μg/ml) and untreated xid splenic B cells were stimulated with F(ab′)2-anti-mouse IgG+M (F(ab′)2-anti-Ig, 10 μg/ml) for 0, 2, 5, and 10 min. The cells were fixed, and F-actin was stained with AF488-phalloidin. The cells were analyzed using flow cytometry. Shown are the average fluorescence intensities (±SD) of phalloidin staining at the indicated times from three independent experiments. BD, Splenic B cells from wt and xid mice were incubated with Cy3-Fab-anti-mouse μ-chain (Fab-anti-μ) and stimulated with F(ab′)2-anti-Ig for 1, 2, and 5 min at 37°C. In the last minute of the stimulation, cells were incubated with AF488-G-actin in the presence of detergent to label newly polymerizing F-actin. The cells were immediately fixed and analyzed using a confocal fluorescence microscope. Shown are representative images from three independent experiments (B). Bar, 5 μm. Images were quantitatively analyzed to determine the fluorescence intensity of cell-associated AF488-G-actin (C) and the correlation coefficients between the labeled BCR and AF488-G-actin (D). Shown are mean values (±SD) from three independent experiments where over 300 cells were individually analyzed using Zeiss LMS 510 software (*, p ≤ 0.01).
FIGURE 2
FIGURE 2
BCR stimulation induces Btk-dependent WASP activation. A, The surface BCR on wt splenic B cells was labeled with Cy3-Fab-anti-μ and either left unstimulated (−XL) or stimulated with F(ab′)2-anti-Ig at 37°C for indicated times. The cells were fixed, permeabilized, and stained with an Ab specific for oWASP. Cells were analyzed using the Deltavision deconvolution microscope. Shown are representative images from three independent experiments. Bar, 3 μm. B, The surface BCR of splenic B cells from wt (ah) and xid (ip) mice were labeled and stimulated as described in A. After fixation and permeabilization, cells were labeled with AF488-phalloidin and an Ab specific for oWASP, and analyzed using a confocal fluorescence microscope. Bar, 3 μm. C, The colocalization coefficients between oWASP and BCR (a), BCR and F-actin (b), and oWASP and F-actin (c) for wt and xid B cells were quantified using the LSM 510 software. Shown are the average values (±SD) from three independent experiments of ≥300 cells (*, p ≤ 0.01).
FIGURE 3
FIGURE 3
BCR activation increases the phosphorylation of WASP and colocalization of pWASP with the BCR in a Btk-dependent manner. A, Splenic B cells from wt and xid mice were stained with Cy3-Fab-anti-μ for the BCR and stimulated with F(ab′)2-anti-Ig at 37°C for indicated times. The cells were fixed, permeabilized, and stained with an Ab specific for WASP phosphorylated at S483/S484 (pWASP). The cells were analyzed using a confocal fluorescence microscope. Shown are representative images of three independent experiments. Bar, 3 μm. B, Shown are the means (±SD) of pWASP fluorescence intensity of >300 cells from three independent experiments (*, p ≤ 0.005). C and D, Cells showing membrane redistribution of pWASP were visually determined and quantified. The data were plotted as percentages of total cells in images (C). The correlation coefficients between the BCR and pWASP in wt and xid B cells were determined using the LSM 510 software (D). Shown are the average results of three independent experiments where >300 cells were analyzed (*, p ≤ 0.005). EH, A20 B cells that were treated with or without LFM A-13 (E and G) and splenic B cells from wt and xid mice (F and H) were stimulated with F(ab′)2-anti-Ig for indicated times. The cells were lysed, and the cell lysates were analyzed using SDS-PAGE and Western blot, and probed for pWASP S483/S484. The blots were stripped and reprobed for tubulin as loading controls. The blots were analyzed by densitometry. pWASP levels were normalized against tubulin levels, and the data were plotted as fold increases over unstimulated levels (G and H). Shown are representative blots and plots of three independent experiments (*, p ≤ 0.05).
FIGURE 4
FIGURE 4
The Btk xid mutation inhibits BCR-induced WASP phosphorylation in all subsets of splenic B cells. Splenic B cells from wt and xid mice were incubated with AF488-anti-mouse IgM at 4°C. To activate the BCR, cells were warmed up to 37°C for 5 min in the presence of AF488-anti-mouse IgM. The cells were then washed, fixed, and stained with PE-Cy5-anti-mouse B220 and PE-anti-mouse IgD. After fixation and permeabilization, cells were incubated with anti-mouse pWASP (S483/S484) Ab. The cells were analyzed using flow cytometry. Three subsets of splenic B cells were gated, including B220+IgMlowIgDhigh mature follicular (FO), B220+IgMhighIgDhigh transitional T2, and B220+IgMhighIgDlow T1 and MZ B cells (A). Shown are representative histograms of pWASP levels in each B cell subset from wt and xid spleens, with (+XL) and without (−XL) BCR XL, from three independent experiments (B).
FIGURE 5
FIGURE 5
BCR activation induces Btk-dependent increase in PdtIns-4,5-P2 levels. Splenic B cells from wt (Aa-i) and xid (Aj-r) mice were incubated with Cy3-Fab-anti-Ig to label the BCR and activated with F(ab′)2-anti-Ig for indicated times at 37°C. The cells were fixed, permeabilized, and stained with an anti-PtdIns-4,5-P2 mAb followed by a Cy2-conjugated secondary Ab. The cells were analyzed by a confocal fluorescence microscope. Shown are representative images from three independent experiments (A). Bar, 3 μm. The colocalization between the BCR and PtdIns-4,5-P2 (PIP2) staining in wt and xid B cells was quantified as correlation coefficients using the LSM 510 software (B). Shown are the average results (±SE) of two independent experiments where >200 cells were analyzed. PtdIns-4,5-P2 (PIP2) levels in untreated and LFM A-13-treated A20 cells were analyzed by flow cytometry (C). Shown are the MFI (±SD) of PtdIns-4,5-P2 that were plotted against time (*, p ≤ 0.01).
FIGURE 6
FIGURE 6
BCR activation induces Btk-dependent phosphorylation of Vav and recruitment of phosphorylated Vav to the BCR. A, The surface BCR of splenic B cells from wt (ai) and xid mice (jr) were labeled with Cy3-Fab-anti-μ and activated with F(ab′)2-anti-Ig for varying lengths of time. The cells were fixed, permeabilized, and stained with an Ab specific for phosphorylated Vav at Y174 (pVav). Images were acquired using a confocal fluorescence microscope. Shown are representative images from three independent experiments. Bar, 3 μm. B, The wt splenic B cells that were treated or untreated with LFM A-13 and xid splenic B cells were activated with F(ab′)2-anti-Ig for varying lengths of time. The cells were fixed, permeabilized, and stained with an Ab specific for pVav Y174. The MFI of pVav was quantified using flow cytometry. Shown is a representative plot of pVav MFI vs the time from three independent experiments. CF, A20 B cells that were treated with LFM A-13 or left untreated (C and D)as well as splenic wt and xid B cells (E and F) were stimulated with F(ab′)2-anti-Ig for indicated times and lysed. The lysates were analyzed by SDS-PAGE and Western blot, and probed for pVav Y174. The blots were stripped and reprobed for tubulin as loading controls. The blots were analyzed using densitometry. pVav levels were normalized against tubulin levels, presented as fold increases over unstimulated B cells, and plotted as a function of time. Shown are representative blots and average pVav levels from three independent experiments.
FIGURE 7
FIGURE 7
Btk inhibitor and xid mutation inhibit BCR internalization and intracellular movement to late endosomes. AC, Splenic B cells from wt and xid mice were incubated with Cy3-Fab-anti-μ at 4°C to label the surface BCR and treated with or without F(ab′)2-anti-Ig for 30 min at 37°C. Then cells were incubated with AF488-CTX-B at 4°C to demarcate the cell surface (A). The cells were fixed, permeabilized, and stained for LAMP-1 using a mAb (ID4B) for marking late endosomes (Bg-l). To mark early endosomes, splenic B cells from wt and xid mice were labeled with Cy3-Fab-anti-μ in the presence of F(ab′)2-anti-Ig at 18°C for 30 min and chased at 37°C for 30 min in the presence of AF488-holo-Tf (Ba-f). The cells were analyzed using a confocal fluorescence microscope. Representative images from three independent experiments are shown. Bar, 3 μm. C, The correlation coefficients between BCR and LAMP-1 staining were determined from images of ≥300 cells from three independent experiments using the Zeiss LSM 510 software (*, p ≤ 0.05).D, Splenic B cells from wt and xid mice and LFM A-13-treated wt and A20 B cells were incubated with biotinylated F(ab′)2-anti-Ig at 4°C to label the surface BCR. After washing, cells were incubated at 37°C for indicated times. Biotin-F(ab′)2-anti-Ig remaining on the cell surface after the chase was detected with PE-streptavidin and quantified using flow cytometry. Shown are the average percentages (±SD) of biotin-F(ab′)2-anti-Ig remaining on the cell surface from three independent experiments (*, p ≤ 0.05).
FIGURE 8
FIGURE 8
The Btk xid mutation decreases the rate of BCR internalization in both mature and transitional splenic B cells. Splenic B cells from wt and xid mice were labeled with PE-Cy5 anti-mouse B220, FITC-anti-mouse AA4.1 (CD93), and biotin-F(ab′)2-anti-mouse IgM at 4°C and chased at 37°C for varying lengths of time. BCR internalization was analyzed as described in Fig. 7. BCR internalization in mature and immature B cell subsets (B) was measured by gating for B220+AA4.1 (mature) and B220+AA4.1+ (immature/transitional B cells) (A). Shown are data from two independent experiments.
FIGURE 9
FIGURE 9
The Ag-presentation efficiency is reduced in both Btk-deficient B cells and Btk inhibitor-treated B cells. A and B, Splenic B cells from xid and wt mice (A) or splenic B cells from wt mice that were serum starved and treated with or without LFM A-13 (B) were pulsed with HEL (1 μg/ml) alone or with the Ab complex that targets HEL to the BCR at 37°C for 15 min. After washing, cells were incubated at 37°C for 14 h. MHC class II I-Ak loaded with HEL peptides (HEL46–61: I-Ak) on the cell surface was detected using a mAb (C4H3) and quantified using flow cytometry. Shown are representative histograms of three independent experiments. C and D, Shown are the ratios of MFI of HEL46–61:I-Ak on the surface of B cells that were pulsed with the HEL-Ab complex, which targets HEL to the BCR, vs those B cells that were pulsed with HEL alone, where HEL was internalized through pinocytosis. Shown are average values (±SD) of three independent experiments (*, p ≤ 0.01). E, Splenic B cells (1 × 10⁶) from wt and xid mice were either incubated with HEL (1 μg/ml) alone or with the Ab complex for 24 h. After washing, the B cells (1×10⁶) were cocultured overnight with KZH T cells (1 × 10⁶). The activity of LacZ that is under the control of IL-2 promoter in the T cells was measured using a colorimetric LacZ substrate. Shown is the OD of the LacZ enzymatic product over time and representative data of three independent experiments with triplicates (*, p ≤ 0.005).

References

    1. Cheng PC, Cherukuri A, Dykstra M, Malapati S, Sproul T, Chen MR, Pierce SK. Floating the raft hypothesis: the roles of lipid rafts in B cell antigen receptor function. Semin. Immunol. 2001;13:107–114. - PubMed
    1. Reth M, Wienands J. Initiation and processing of signals from the B cell antigen receptor. Annu. Rev. Immunol. 1997;15:453–479. - PubMed
    1. Song W, Cho H, Cheng P, Pierce SK. Entry of B cell antigen receptor and antigen into class II peptide-loading compartment is independent of receptor cross-linking. J. Immunol. 1995;155:4255–4263. - PubMed
    1. Cheng PC, Steele CR, Gu L, Song W, Pierce SK. MHC class II antigen processing in B cells: accelerated intracellular targeting of antigens. J. Immunol. 1999;162:7171–7180. - PubMed
    1. Siemasko K, Skaggs, J. B, Kabak S, Williamson E, Brown BK, Song W, Clark, R. M. Receptor facilitated antigen presentation requires the recruitment of B cell linker protein to Igα. J. Immunol. 2002;168:2127–2138. - PubMed

Publication types

MeSH terms